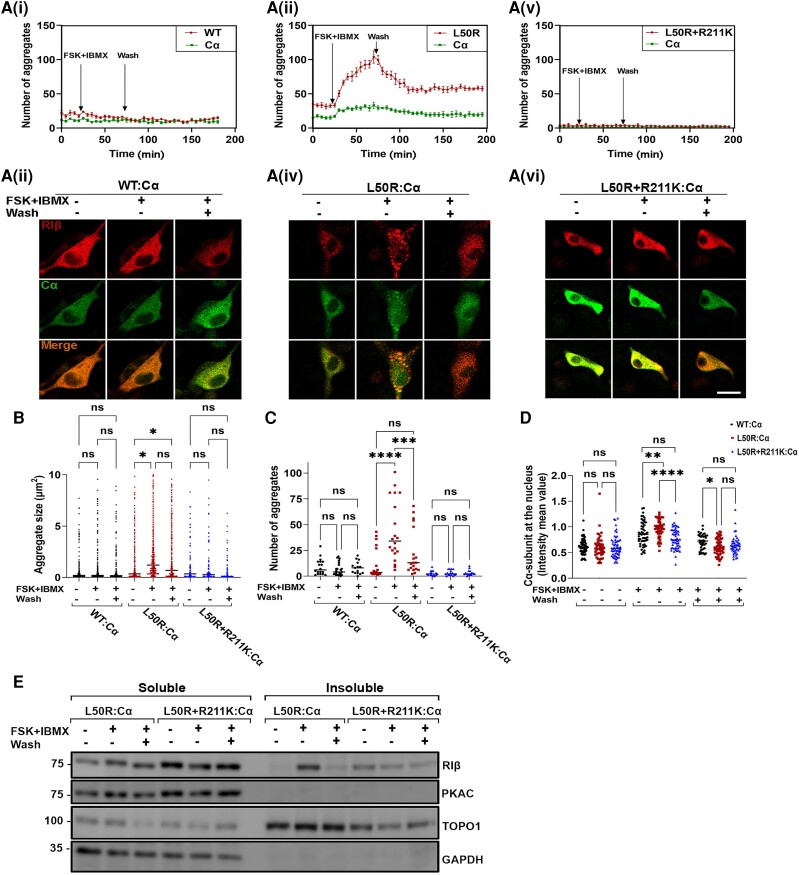
Figure 4.
Protein aggregation is dependent on cAMP concentration in the cell. [A(i–vi)] Live cell imaging of rat pheochromocytoma (PC12) cells co-transfected to express catalytic subunit-α (Cα) and RIβ-wild-type (RIβ-WT) (i and ii), Cα and RIβ-L50R (iii and iv) or Cα and RIβ-L50R+R211K (v and vi). Cells were treated with 20 mM forskolin and 200 mM IBMX. Cells were imaged for 30 min before treatment, 30 min after treatment, and 60 min after washing the treatment. The number of aggregates was counted in RIβ-WT or mutants and Cα-expressing cells (i, iii and vi) over the course of the whole experiment. Images at three indicated time points taken from the live experiment are shown in ii, iv and vi, respectively. Scale bar = 20 mm. (B) Aggregate sizes (mm2) in cells expressing RIβ-WT or mutants were measured in ∼70 cells per condition. One-way ANOVA with Tukey’s post hoc honest significant difference (HSD) test. *P < 0.05; ns = non-significant comparison. (C) The number of aggregates were counted for each condition. One-way ANOVA with Tukey’s post hoc HSD test. **P < 0.01, ****P < 0.0001. (D) Nuclear mean fluorescence intensity to (cytoplasmic mean fluorescence intensity + nuclear mean fluorescence intensity) ratio was calculated for C-subunit. One-way ANOVA with Tukey’s post hoc HSD test. (E) Cell lysates of co-transfected cells expressing the indicated mutants were divided into soluble and insoluble fractions. GAPDH and TOPO1 were used as loading controls for the soluble and insoluble fractions, respectively. Cells transfected with plasmids with the indicated mutations were expressed similar levels of proteins for each treatment.

