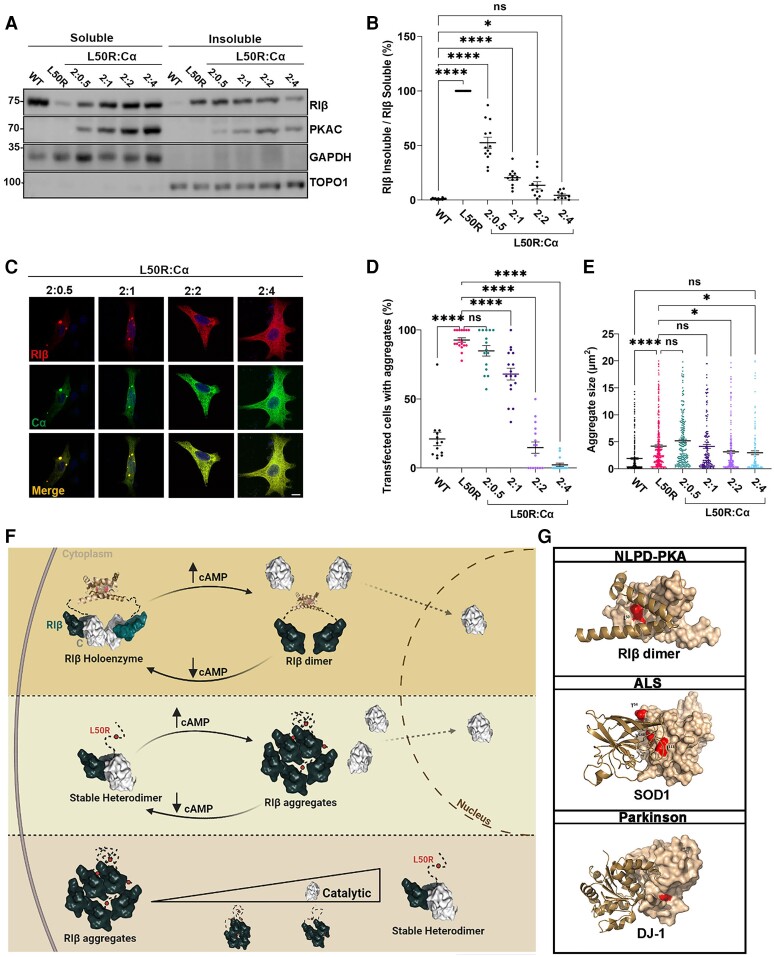
Figure 5.
RIβ aggregation formation is inhibited by increasing C-subunit protein expression levels. (A) PC12 cells were transfected to express RIβ-wild-type (WT) or RIβ-L50R alone to compare protein solubility. The RIβ-L50R-encoding plasmid was co-transfected with increasing amounts of the Cα-subunit-encoding plasmid at the indicated ratios. Protein lysates were divided to soluble and insoluble fractions, separated by sodium dodecyl-sulfate polyacrylamide gel electrophoresis (SDS-PAGE) and immunoblotted with specific antibodies. GAPDH and TOPO1 were used as loading controls for the soluble and insoluble fractions, respectively. (B) Quantitative analysis of western blot intensities. Lysates from three independent experiments underwent multiple SDS-PAGE runs. Each dot represents the ratio of RIβ-L50R insoluble divided by RIβ-L50R soluble from distinct gel runs. One-way ANOVA with Dunnett’s post hoc test. (C) Representative confocal images of PC12 cells co-transfected to generate the indicated RIβ:C ratios. RIβ (red); Cα (green). Scale bar = 20 mm. (D) Quantification of transfected cells with aggregates at indicated RIβ-L50R:Ca ratios from total cells (%) from 132 cells for RIβ WT, 154 for L50R, 119 for a 2:0.5 ratio, 112 for a 2:1 ratio, 117 for a 2:2 ratio and 142 for a 2:4 ratio. Each dot in the graph represent % transfected cells with aggregates in an image taken at ×20. Statistics from three independent experiments. One-way ANOVA with Dunnett’s post hoc test. ****P < 0.00001; ns = non-significant comparison. (E) Same images as in D quantified for aggregate size (mm2) at the indicated RIβ-L50R:Cα ratios. One-way ANOVA with Tukey’s post hoc honest significant difference test. (F) Schematic illustration that emphasizes the differences between the healthy and disease state regarding RIβ dimerization, catalytic subunit binding, protein aggregation, and nuclear translocation in response to cAMP levels. (G) Dimers of the RIβ dimerization and docking (D/D) domain, SOD1 and DJ-1 proteins (Protein Data Bank accession numbers are: 4F9K, 1HL4 and 1J42, respectively). One protomer is depicted as a surfaces representation, while the second protomer is represented by helix structures. Red surfaces indicate the location of identified mutations at the dimer interface. Residues T54, I113 and V148 are shown in SOD1. L166 is shown in DJ-1.

