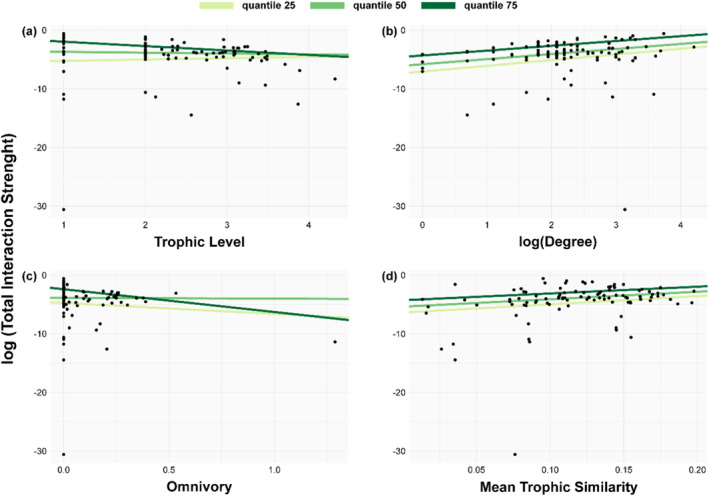
FIGURE 4.

Relationships between weighted (total interaction strength) and unweighted food web properties. We fitted quantile regressions (light green line = quantile 25, medium green line = quantile 50, dark green line = quantile 75) to show the tendency between log total interaction strength and (a) trophic level, (b) degree, (c) omnivory, and (d) trophic similarity.
