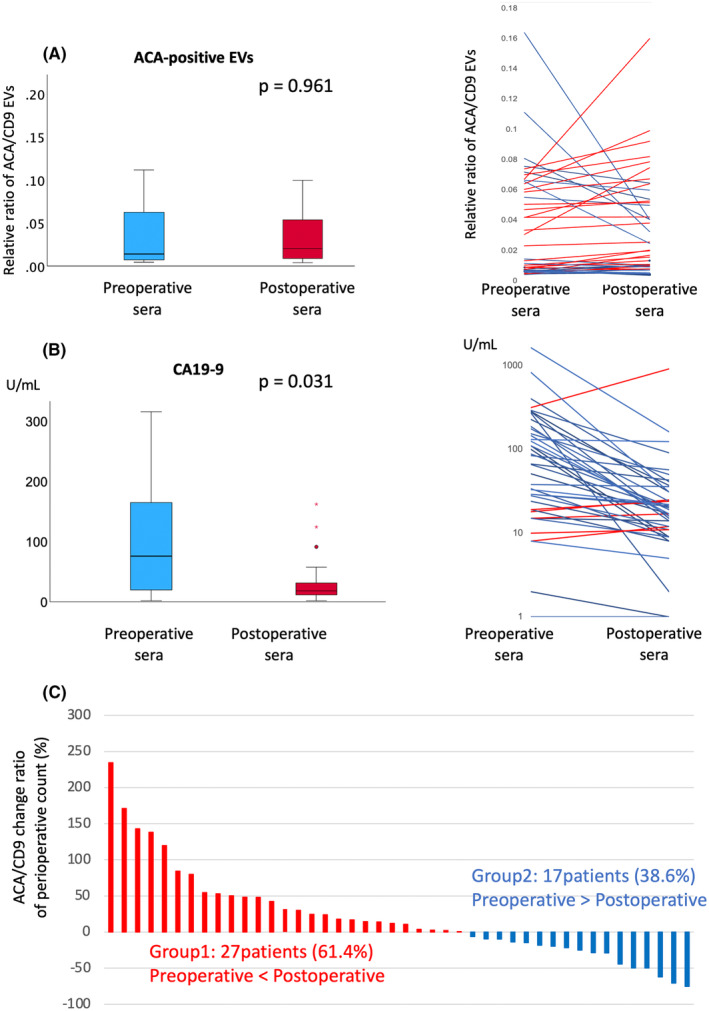
FIGURE 3.

Comparison of ACA‐positive EVs (A) and CA19‐9 levels (B) between pre‐ and postoperative PDAC sera. ACA‐positive EV counts were normalized to CD9‐positive EV counts. The box plot indicates the 25th to 75th percentiles, with medians represented by colored bars. P values were calculated using the Mann–Whitney U test. Raw data for the comparison of ACA‐positive EVs (A) and CA19‐9 levels (B) between pre‐ and postoperative PDAC sera are shown. The blue line represents cases with decreased postoperative levels compared to preoperative samples, while the red line represents cases with increased levels. (C) Waterfall plot showing the change ratio of ACA‐positive EVs between pre‐ and postoperative sera. Samples were classified into postoperative ACA‐positive EV elevation (Group 1) and decline groups (Group 2). ACA, Amaranthus caudatus agglutinin; CA19‐9, carbohydrate antigen 19–9; CD9, cluster of diffentiation 9; EV, extracellular vesicle; PDAC, pancreatic ductal adenocarcinoma.
