FIGURE 4.

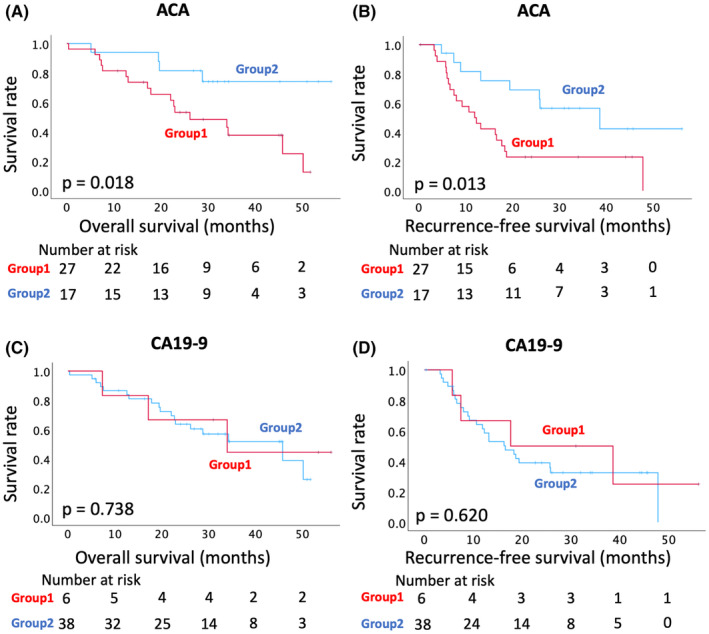
Kaplan–Meier survival analyses with the change in the ACA‐positive EVs in PDAC sera (A) Comparison of the overall survival (OS) between Groups 1 and 2. (B) Comparison of the recurrence‐free survival (RFS) between Groups 1 and 2. (C, D) Kaplan–Meier survival analyses with the change in CA19‐9 levels in PDAC sera. (C) Comparison of the OS between Groups 1 and 2. (D) Comparison of the RFS between Group 1 and 2. Survival curves and P values were calculated using the log‐rank test. ACA, Amaranthus caudatus agglutinin; CA19‐9, carbohydrate antigen 19‐9; EV, extracellular vesicle; PDAC, pancreatic ductal adenocarcinoma.
