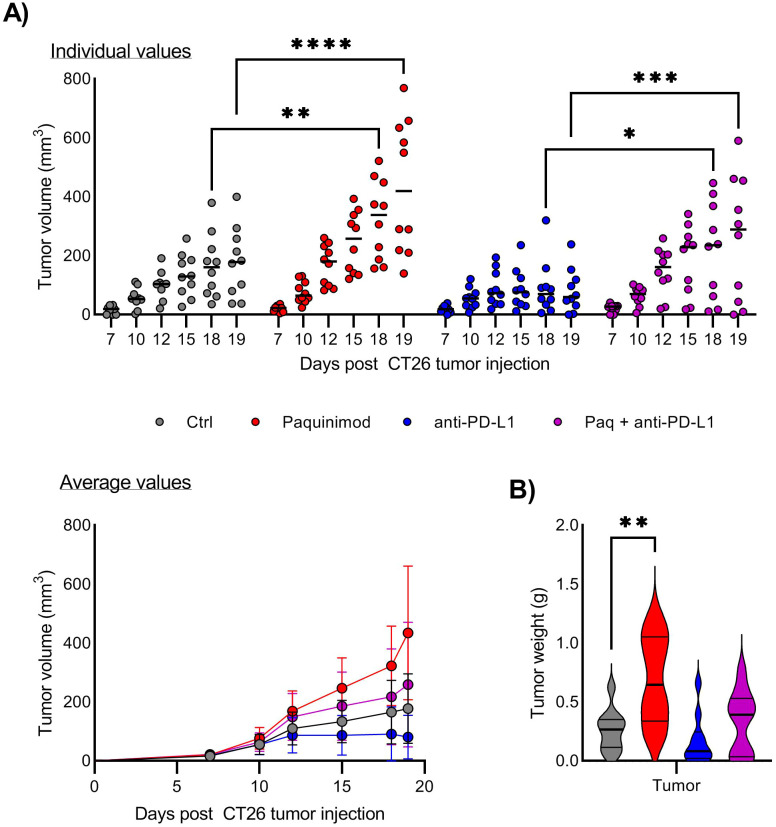
Figure 2.
Effect of Paquinimod treatment on CT26 tumor growth. (A) Growth of CT26 tumors depending on treatment and response. Top panel shows tumor growth of individual mice, and lower panel tumor growth as average +/- SD. BALB/c mice were injected with CT26 tumor cells intradermally and treated with Paquinimod day 0-11 and/or anti-PD-L1 monoclonal antibody every 3 days starting at day 6 or left untreated. Experimental setup is shown in Supplementary Figure 4 . Tumors were measured every 2-3 days and tumor volume is calculated as l*w*h*3,14/6. N=10. Graph shows representative experiment from 3 repeats. (B) Tumor weight at harvest day 19. Statistically significant differences between treatment groups are denoted *, **, *** or **** depending on p-values as described in methods section.

