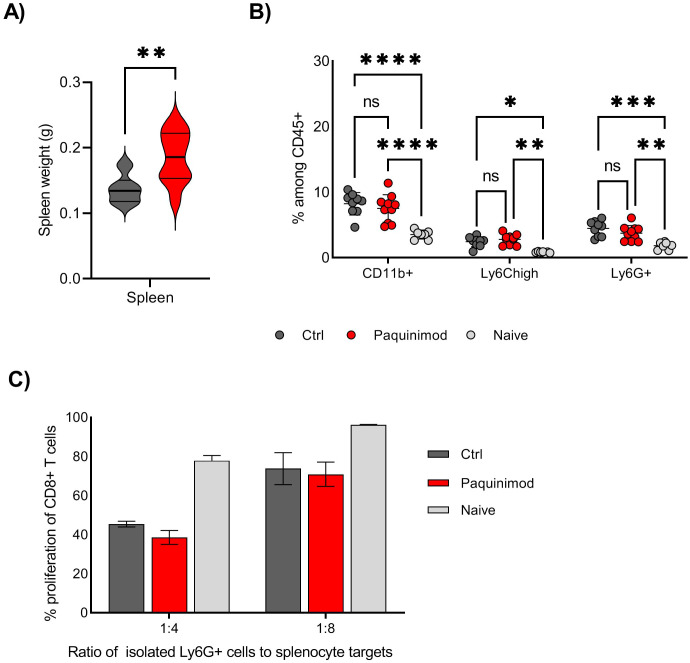
Figure 3.
Effect of Paquinimod treatment on spleen and myeloid cells. (A) Average spleen weight at harvest day 19. BALB/c mice were injected with CT26 tumor cells intradermally and treated with Paquinimod day 0-11 or left untreated. N=10. Graph shows representative experiment from 3 repeats. (B) Frequency of total CD11b+ cells, Ly6G+ and Ly6Chigh myeloid cells in individual spleens, harvested at day 19. N=10, 10 and 7. Graph shows representative experiment from 3 repeats. Statistically significant differences between treatment groups are denoted *, **, *** or **** depending on p-values as described in methods section. (C) T cell suppression assay using Ly6G+ cells isolated from spleen as effector cells and splenocytes from naïve, non-tumor bearing mice as target cells. Spleens from 10, 10 and 7 mice (Ctrl, Paquinimod treated and naïve) were harvested day 19 post tumor injection and pooled prior to Ly6G isolation. Graphs shows representative experiment from 3 repeats with error bars showing standard deviation from technical repeats, N=3. ns, not significant.

