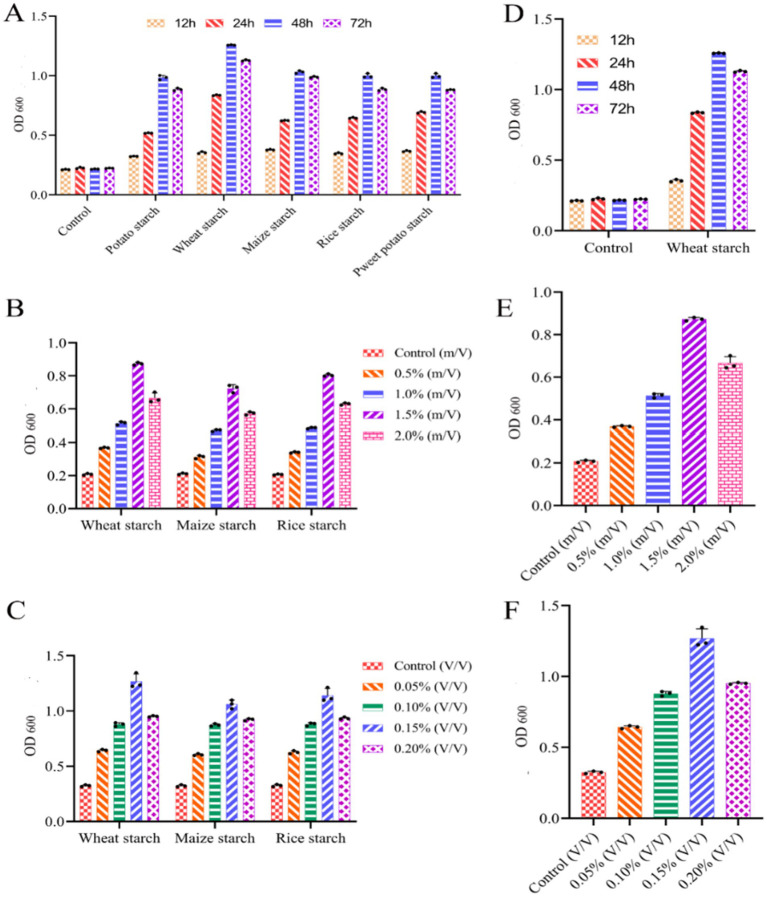
Figure 5.
Single factor experimental analysis of LAB. (A) Growth in different starch leaching solutions at different times (1.5% starch leaching solution and 0.1% inoculation); (B) growth with different concentrations of starch extracts in a 48 h culture; (C) growth with different inoculum in a 48 h culture and 1.5% starch extract; (D) Growth vs. time in culture medium containing 1.5% wheat extract; (E) growth in different contents of wheat extract; (F) growth vs. volume of bacteria. Control measurements used culture medium without inoculation. LAB growth was measured at 600 nm, where 1 OD is equivalent to 1 × 10⁸ cells/mL. All results are presented as means ± SE n = 3.

