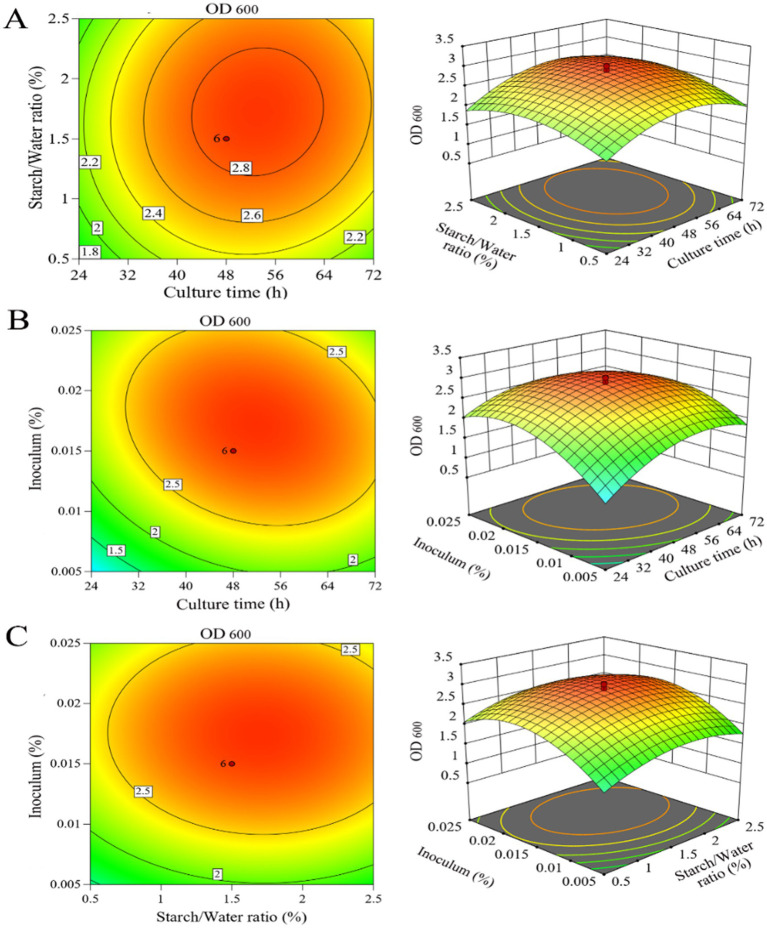
Figure 6.
Three-dimensional response surface analysis and contour plots for LAB. (A) Effect of culture time and starch/water ratio when inoculum is 0.015%; (B) effect of culture time and inoculum when starch/water ratio level is 1.5%; (C) effect of starch/water ratio and inoculum when culture time is 48 h.

