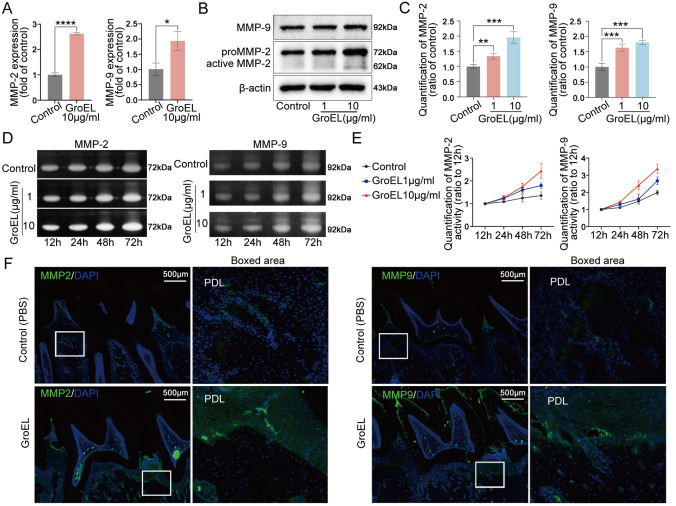
Figure 2 .
GroEL increases MMP-2 and MMP-9 activities in hPDLSCs both in vitro and in vivo
(A) qPCR showing the mRNA expressions of MMP-2 and MMP-9 in hPDLSCs induced by GroEL. The data were derived from three separate experiments ( n=3). * P<0.05, **** P<0.0001. (B) Western blot images showing the protein expressions of MMP-2 and MMP-9 in hPDLSCs treated with GroEL. The images were chosen from three separate experiments ( n=3). (C) Quantitative analysis confirming the changes in the levels of the MMP-2 and MMP-9 proteins in (B). Relative protein expression was normalized to that of β-actin. The data were derived from three separate experiments ( n=3). ** P<0.01, *** P<0.001. (D) Gelatin zymography images showing the increased activities of MMP-2 and MMP-9 in GroEL-treated hPDLSCs. The images are based on three separate experiments ( n=3). (E) Quantitative analysis confirming the increased activities of MMP-2 and MMP-9 in (D). The data were derived from three separate experiments ( n=3). (F) Immunohistofluorescence images illustrating the increased expression of MMP-2 and MMP-9 in rat periodontal tissues 4 weeks after the injection of GroEL. MMP-2 and MMP-9, green; nuclei, blue. The data were derived from four separate experiments ( n=4).

