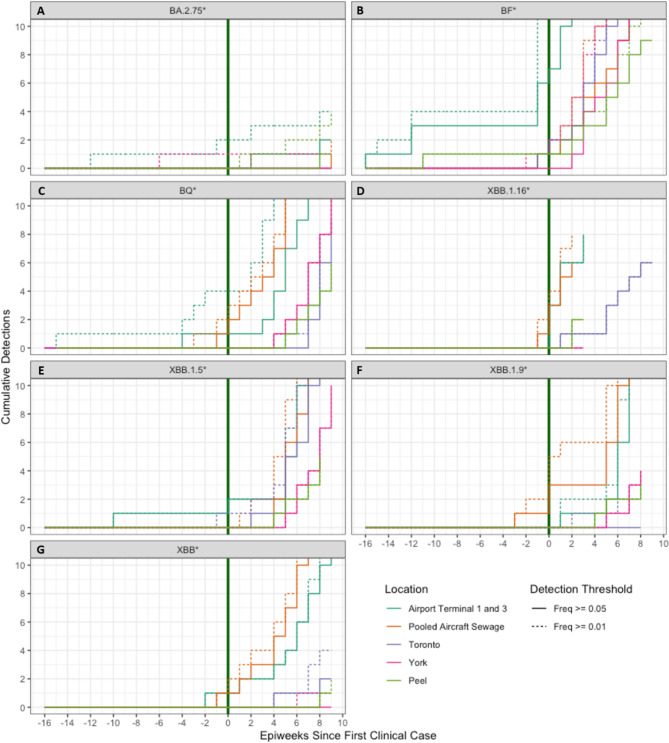
Fig. 3.
Cumulative detection probabilities for each lineage and location. Dotted lines represent detections with a 0.01 (1%) detection threshold, and solid lines represent detections with a threshold of 0.05 (5%). The x-axis represents the weeks since the first PHO reported Ontario clinical case, with negative values representing detections in WW prior to clinical detections. Each panel represents a single lineage from the following list: BA.2.75* (A), BF* (B), BQ* (C), XBB.1.16* (D), XBB.1.5* (E), XBB.1.9* (F), XBB* (G).

