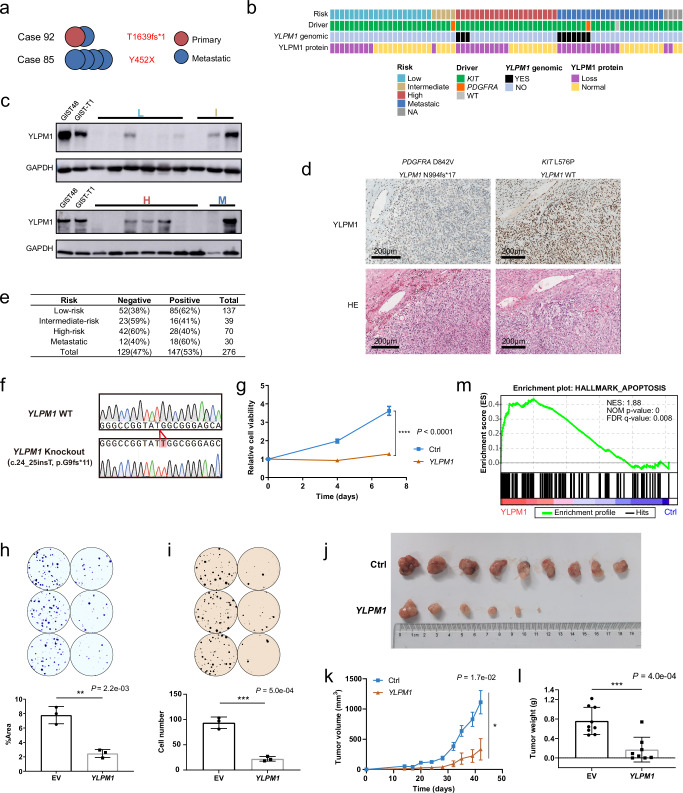
Fig. 3. High frequency of YLPM1 inactivation in GISTs and YLPM1 inactivation promotes tumor growth and proliferation in vitro and in vivo.
a Multiple tumors from the same patients share the same YLPM1 mutation. b Summary of YLPM1 genomic and protein aberrations in 73 GISTs. c YLPM1 protein inactivation is demonstrated by immunoblotting of GIST biopsies. YLPM1 wild-type GIST48 and GIST-T1 cell lines are used as positive controls. YLPM1 inactivation is defined by relative expression level (YLPM1/GAPDH) < 0.3, normalized to GIST-T1. All panels represent data from 3 times independent experiments. d Hematoxylin and eosin stains (bottom) and YLPM1 immunohistochemistry (IHC) stains (top): case 94 with wild-type YLPM1 shows retained YLPM1 expression; case 104 with YLPM1 frameshift mutation shows a loss of YLPM1 expression. e Summary of YLPM1 expression assessed by IHC in tissue microarrays validation cohort. f–m Restoration of YLPM1 suppresses tumor growth and proliferation in YLPM1-inactivated GISTs. f Sanger sequencing shows that GIST-T1YLPM1 KO isogenic cells are successfully established. g Lentivirus-mediated YLPM1 restoration reduces the viability of GIST-T1YLPM1 KO cells, as assessed by CellTiter-Glo viability assay. Data are presented as mean values ± s.d. n = 3. h Crystal violet staining assays show that restoration of YLPM1 suppresses cell proliferation. Representative plates (top) and mean percentage area (bottom) are shown. Data are presented as mean values ± s.d. n = 3. i Restoration of YLPM1 inhibits anchorage-independent growth. Representative plates (top) and mean colony numbers (bottom) are shown. Data are presented as mean values ± s.d. n = 3. j–l Restoration of YLPM1 suppresses the growth of GIST-T1YLPM1 KO xenografts in nude mice. Photo images (j) (n = 9 mice for Ctrl, n = 8 mice for YLPM1 restoration, note that no tumor growth in 2 mice), growth curves (k), and tumor weight (l) of transplanted tumors are shown. Error bars are the mean ± s.e.m.. m GSEA reveals that genes involved in Hallmark apoptosis gene set are upregulated in GIST-T1YLPM1 KO group. NES, normalized enrichment score. NOM P-value, Nominal P-value. All the P values are calculated using the two-sided Student’s t test. Source data are provided as a Source Data file.

