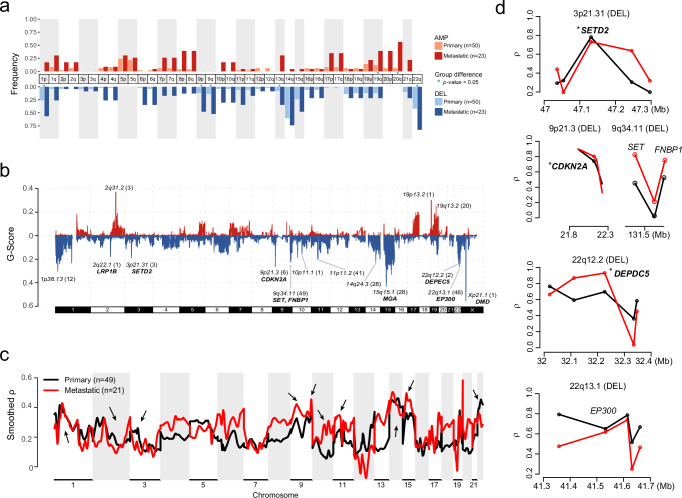
Fig. 4. Genomic imbalances.
a Chromosome arm-level CNV frequencies in different risk stratification of 73 GISTs. Dark red, red and light red represent the amplification (AMP) frequencies in primary (low-risk, intermediate-risk and high-risk, n = 50) and metastatic GISTs (n = 23), respectively. Dark blue, blue and light blue represent the deletion (DEL) frequencies in low or intermediate-risk, high-risk and metastatic GISTs, respectively. Arms with significant group differences are denoted by green asterisks (both the GISTIC q value and chi-square test P value < 0.05). b Focal-level copy number gains and losses across chromosomes 1-22 and X detected by GISTIC 2.0, with the G-score labeled on the vertical axis. Selected cancer-associated genes are labeled in the significant peak regions. c, d Associations between quantitative measurements of CNV and gene expression in different risk groups using MVisAGe R-package. Black represent primary GISTs (n = 49) and red represent metastatic GISTs (n = 21). c Genome-wide plot of smoothed gene-level Pearson correlation coefficients (smoothed ρ values) across chromosomes 1–22. Arrows indicate focal-CNV peaks from GISTIC. d Unsmoothed ρ values and selected genes are plotted based on genomic positions in selected regions from focal-CNV peaks. The asterisks indicate known drivers in GIST. Source data are provided as a Source Data file.

