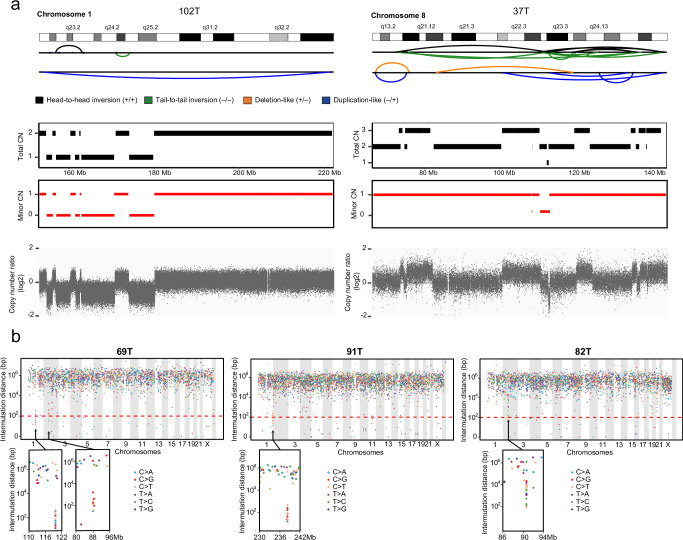
Fig. 5. Complex genomic aberrations.
a SV and CNV profiles for two aggressive cases with CN oscillation features of chromothripsis. (Left) Evidence of chromothripsis on chromosome 1 in a metastatic GIST with CN oscillations between 2 CN levels and LOH. (Right) Evidence of chromothripsis on chromosome 8 in a high-risk GIST with CN oscillations that span 3 CN levels. The chromosome location and the SV calls in the chromothripsis region are shown on the top panel. The subsequent panel displays the total CN (black rectangle), minor CN (red rectangle) and the total copy number log-ratio for SNPs (gray dots) within the affected region. CN, copy number. b Rainfall plots showing the inter-mutation distance versus the genomic position for 3 GISTs with localized hypermutations. The horizontal axis shows mutations ordered by chromosome loci (from the first mutated position on chromosome 1 to the last mutated position on chromosome Y), and the vertical axis represents the inter-mutation distance. The lower section shows the localized hypermutation loci in detail. Source data are provided as a Source Data file.

