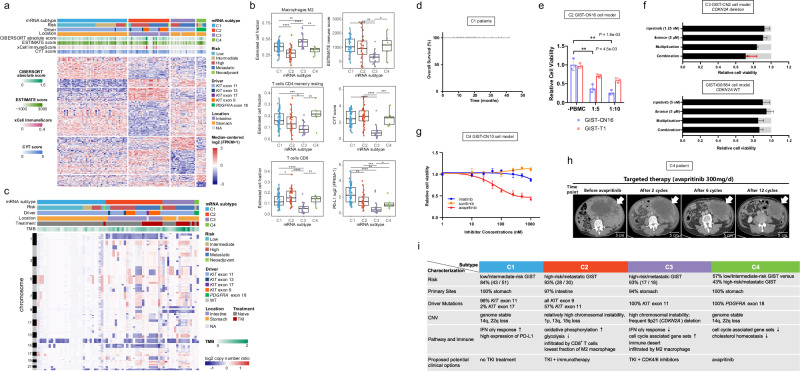
Fig. 7. Molecular subtypes of GISTs.
a Consensus clustering results of GISTs (n = 106) based on the RNA expression. Heatmap shows 520 differentially expressed genes among 4 subtypes. The number of tumors for C1, C2, C3, and C4 subtype is 51, 30, 18, and 7, respectively. Clinical risk stratification, driver mutations, location, immune scores from CIBERSORT, ESTIMATE and xCell and cytolytic (CYT) score are shown. b Boxplots showing the estimated cell fractions, immune score, CYT score and PD-L1 expression among 4 subtypes. The P values are calculated using the two-sided wilcoxon rank-sum test (*P < 0.05; **P < 0.01; ***P < 0.001; ****P < 0.0001). The low, centerline, and upper of boxplot represent the first quartile, the median, and the third quartile of data, respectively. The whiskers extend to the largest and smallest values within 1.5 times IQR. c Copy-number-based clustering results. Heatmap shows log2 copy-number ratio across the genome. d Overall survival of C1 patients (n = 29). e T cell-mediated tumor cell killing assay in C2 subtype cells. After 3 days of incubation of GIST-CN16 or GIST-T1 cells with PBMC, CTG viability assay was performed. Data are presented as mean values ± s.d. n = 3. The P values are calculated using the two-sided Student’s t test. f Cell viability assay reveals the synergistic effect of KIT inhibitor and CDK4/6 inhibitor. Top, GIST-CN2 primary cells established from C3 subtype GIST (94T, CDKN2A deletion). Bottom, GIST430/654 cell line (CDKN2A WT). Light gray bars indicate control values. “Multiplication” indicates expected effect of combined treatment if single-treatment effects are multiplied; red arrow indicates actual effect of combination. Data are presented as mean values ± s.d. n = 3. g GIST-CN10 primary cells established from PDGFRA D842V-mutant, C4 subtype show response to avapritinib, but resistance to imatinib or sunitinib. Data are presented as mean values ± s.d. n = 3. h Clinical data with avapritinib confirm evidence of activity in patient with metastatic C4 subtype GIST. Avapritinib induces rapid radiographic clinical response. i Highlights of the genomic features, expression profiles, immune characteristics and potential treatment strategies for the GIST subtypes. Source data are provided as a Source Data file.

