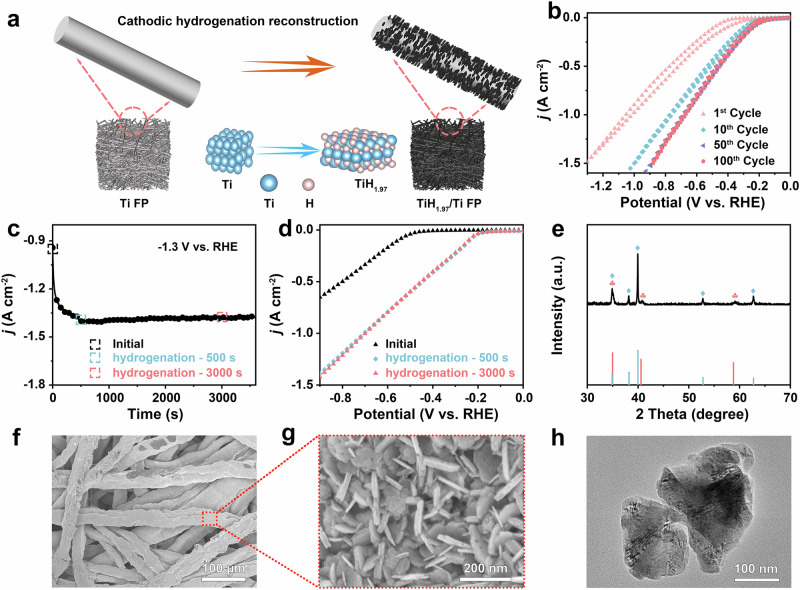
Fig. 1. Preparation and characterization of electrocatalysts.
a A schematic illustration of the electrochemical hydrogenation reconstruction of titanium fiber paper and their corresponding structure diagram. b CV curves of different cycles within the range from 0 to − 1.3 V vs. RHE (without iR compensation). c i-t curve at − 1.3 V vs. RHE (without iR compensation) for 1 h of Ti electrode. d LSV curves of Ti electrode before and after i-t testing (without iR compensation). e XRD spectrum. f, g SEM images (h) TEM image.

