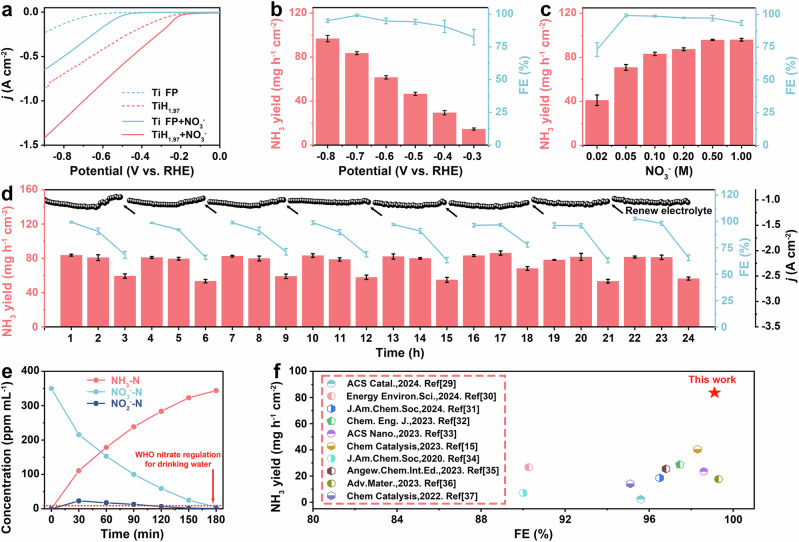
Fig. 3. Electrocatalytic performance in NIRR.
a LSV curves of Ti FP and titanium hydride with and without NO3− (without iR compensation). b NH3 yields and FEs for titanium hydride against various work potentials in 1 M KOH solution with 0.1 M NO3− (without iR compensation). c NH3 yields and FEs for titanium hydride at different concentrations of NO3− (without iR compensation). d Stability test at − 0.7 V vs. RHE (without iR compensation) with periodic updates taken every 3 h. e The time-dependent concentration change of NO3−-N, NO2−-N and NH3-N (without iR compensation). f Comparison of the NIRR performance of the titanium hydride with the reported electrocatalyst (The nitrate concentrations of these reports were equal to 0.1 M). The NH3 yields and FEs are calculated once per hour. Error bars indicate there lative standard deviations of the mean (n = 3).

