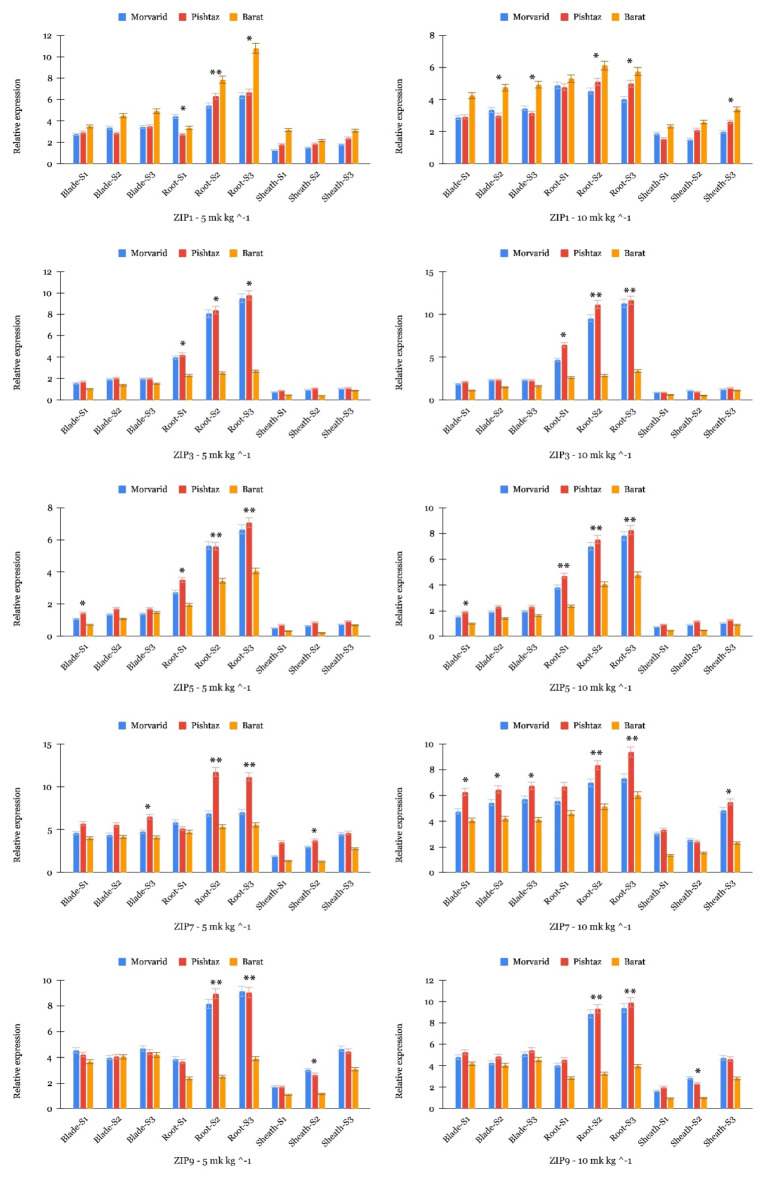
Fig. 5.
Expression profiles of TaZIP genes across different tissues during three developmental stages. The y-axis indicates the expression level of TaZIP genes, while the x-axis represents three tissues: blade, root, and sheath at three developmental stages: tillering (S1), booting (S2), and flowering (S3) for Morvarid, Barat, and Pishtaz cultivars. Asterisks indicate statistical significance levels among cultivars within each tissue/stage, where “*” denotes significance at p < 0.05 and “**” denotes significance at p < 0.01 based on one-way ANOVA.

