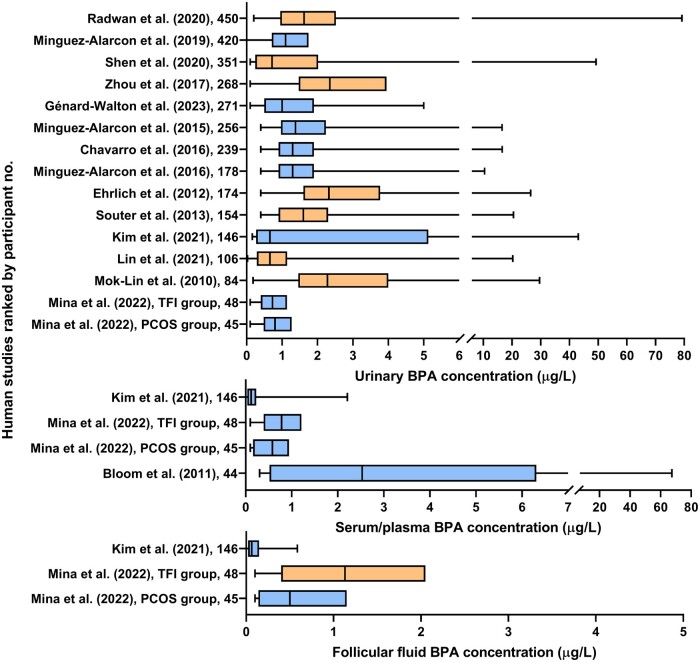
Figure 6.
Box and whisker plot of 15 human observational studies ranked by participant number, displaying urinary, serum, or follicular fluid BPA concentrations of the participants. BPA concentration data presented includes the median, quartile 1, quartile 3, the minimum detected concentration or limit of detection, and maximum detected concentration where available. Orange indicates that the study found an adverse effect associated with BPA concentration, blue indicates the absence of an adverse effect. Six studies did not provide adequate information on the bisphenol concentrations of participant samples and were not included in this figure.

