Figure 2.
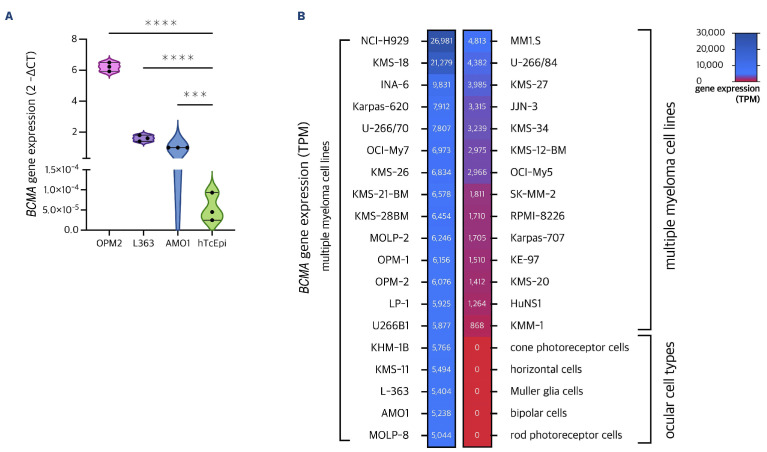
BCMA gene expression across tissues and cell lines. (A) Violin plots were used to show the levels of BCMA gene expression (ng/mL) quantified by quantitative polymerase chain reaction (qPCR) using Taqman real-time PCR in 3 multiple myeloma (MM) cell lines (OPM2, L363, AM01) and human telomerase-immortalized corneal epithelial (hTcEpi) cells. Expression is given as fold gene expression normalized to AM01 using the b-b Ct method. BCMA gene expression is highest in OPM2, followed by L363 and AM01. AM01 (P=0.0003), L363 (P<0.0001) and OPM2 (P<0.0001) show significantly higher BCMA gene expression as compared to hTcEpi for which BCMA gene expression remains absent. (B) Heatmap summarizing TNFRSF17 expression in a larger set of MM cell lines and distinct tissues from the ocular system. Expression data was retrieved from publicly available datasets (humanproteinatlas.org) and is given as normalized transcripts per million (TPM). ***P<0.001; ****P<0.0001.

