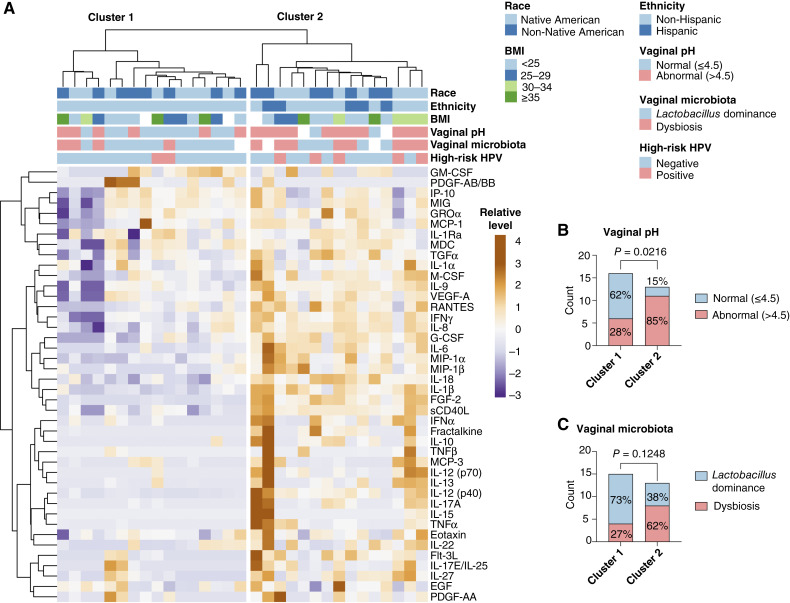
Figure 4.
Vaginal profiles of cytokines, chemokines, and growth factors. A, heatmap reflects relative levels of proteins in vaginal swab samples. Unsupervised hierarchical clustering was used to assess the similarity between protein profiles. Two main clusters based on Euclidean distance and Ward linkage were observed. B, Stacked bar plots show the distribution of patients with normal and abnormal pH or C,Lactobacillus-dominant and dysbiotic Lactobacillus-depleted microbiota between the clusters. P values were calculated using the Fisher exact test. Unsupervised hierarchical clustering analysis indicates that immune marker levels associate with vaginal pH and Lactobacillus dominance.

