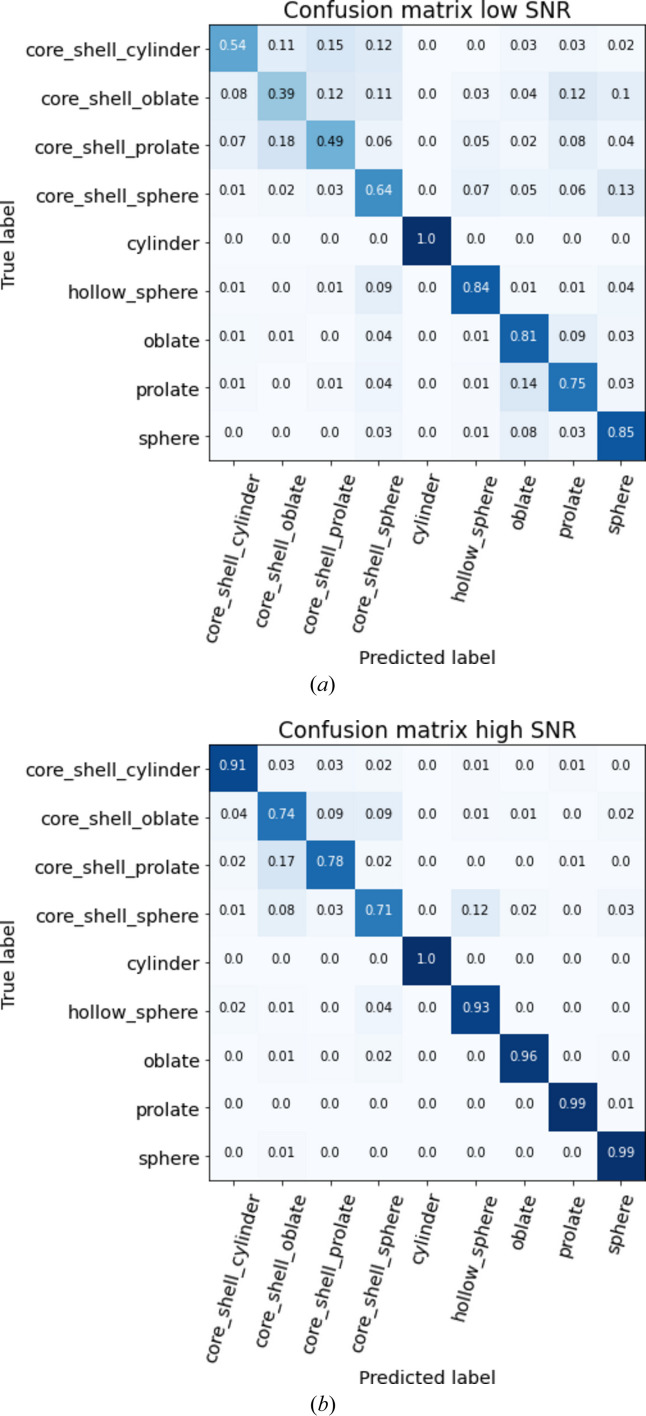
Figure 3.
Confusion matrices of the predictor trained on the all-times data set. The confusion matrix for low SNR is derived from data with SNR between 100 and 400, while the high-SNR matrix uses data with SNR from 4000 to 9000. These confusion matrices are normalized by the number of predictions, so that the sum of a row is equal to 1. As an example, on (a) 85% of the spheres were well classified, 3% were confused with prolates, 8% with oblates, 1% with hollow spheres and 3% with core–shell spheres.

