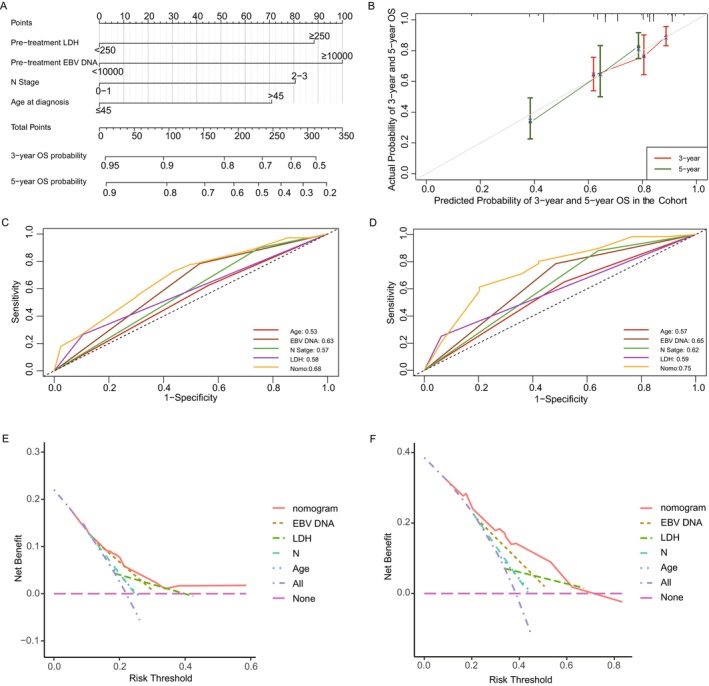
FIGURE 3.

Construction and assessment of nomogram of the whole cohort. (A) Nomogram model predicting 3‐ and 5‐year OS in primary bone‐only oligometastatic NPC patients. (B) The calibration curves for predicting OS at 3 and 5 years. (C) ROC curves evaluating the nomogram against its four individual variables for 3‐year OS predictions. (D) ROC curves evaluating the nomogram against its four individual variables for 5‐year OS predictions. (E) DCA assessing the predictive utility of the nomogram and its four component variables for 3‐year OS. (F) DCA assessing the predictive utility of the nomogram and its four component variables for 5‐year OS. ROC, receiver operating characteristic; DCA, decision curve analysis.
