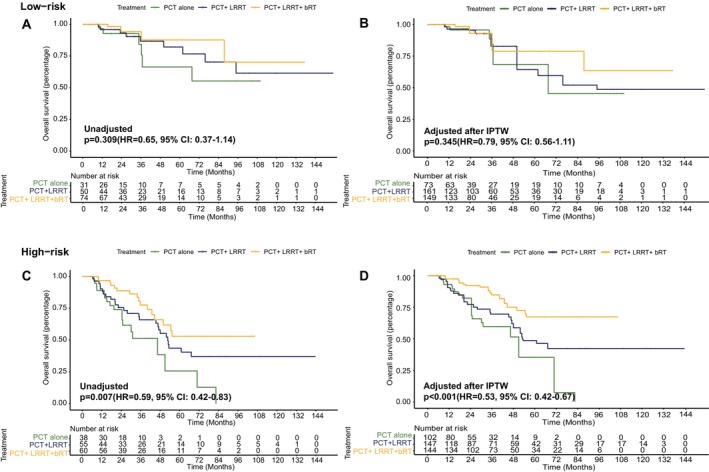
FIGURE 4.

Comparison of overall survival between low‐risk and high‐risk groups based on the predictor from the nomogram model and impact of radiotherapy modalities in two groups. (A) Unadjusted Kaplan–Meier curves of OS for low‐risk patients receiving PCT alone, PCT + LRRT, and PCT + LRRT + bRT; (B) adjusted Kaplan–Meier curves of OS for low‐risk patients receiving PCT alone, PCT + LRRT, and PCT + LRRT + bRT; (C) unadjusted Kaplan–Meier curves of OS for high‐risk patients receiving PCT alone, PCT + LRRT, and PCT + LRRT + bRT; (D) adjusted Kaplan–Meier curves of OS for high‐risk patients receiving PCT alone, PCT + LRRT, and PCT + LRRT + bRT.
