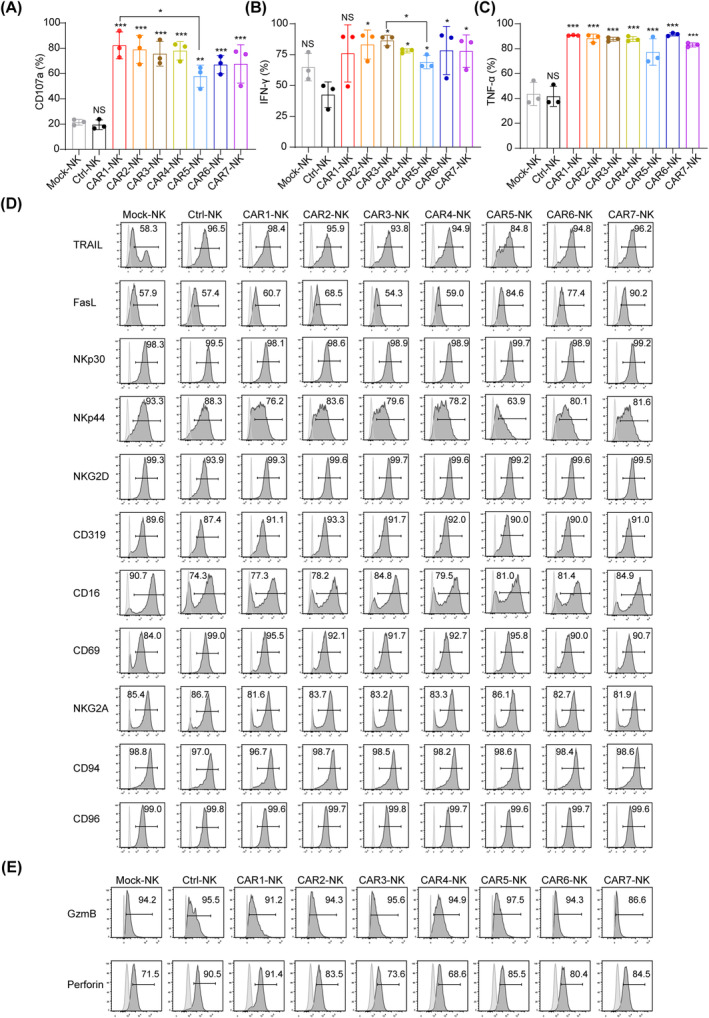
FIGURE 3.

Molecular characterization of seven CD19 CAR‐NK cells. (A) Measurement of CD107a expression in CAR‐NK cells in response to Nalm‐6 cells. Mock‐NK, Ctrl‐NK and CAR‐NK cells were stimulated at the E:T ratio of 0.5:1 for 4 h. CD107a+ cells were gated on CD56+ (Mock‐NK), CD56+EGFP+ (Ctrl‐NK) or CD56+CAR+ (CAR‐NK) cells. Statistics: one‐way ANOVA and two‐tailed Student's t test, Mock‐NK versus other NK groups, ***p < 0.001, **p < 0.01, *p < 0.05, NS, not significant. (B, C) Assessment of IFN‐γ (B) and TNF‐α (C) production by Mock‐NK, Ctrl‐NK and CAR‐NK cells following 4‐h co‐culture with Nalm‐6 tumour cells. IFN‐γ+ and TNF‐α+ cells were gated on CD56+ (Mock‐NK), CD56+EGFP+ (Ctrl‐NK) and CD56+CAR+ (CAR‐NK) cells. Statistics: one‐way ANOVA, two‐tailed Student's t test, and Mann–Whitney U test, Mock‐NK or Ctrl‐NK versus other NK groups, ***p < 0.001, *p < 0.05, NS, not significant. (D, E) The expression analysis of apoptosis‐related ligands (TRAIL and FasL), typical NK cell receptors (NKp30, NKp44, NKG2D, CD319, CD16, CD69, NKG2A, CD94 and CD96) (D), and effector molecules (GzmB and Perforin) (E). Control histograms represent FMO control. CAR, chimeric antigen receptor; IFN‐γ, interferon‐gamma; NK, natural killer; TNF‐α, tumour necrosis factor‐alpha.
