
FIGURE 4.
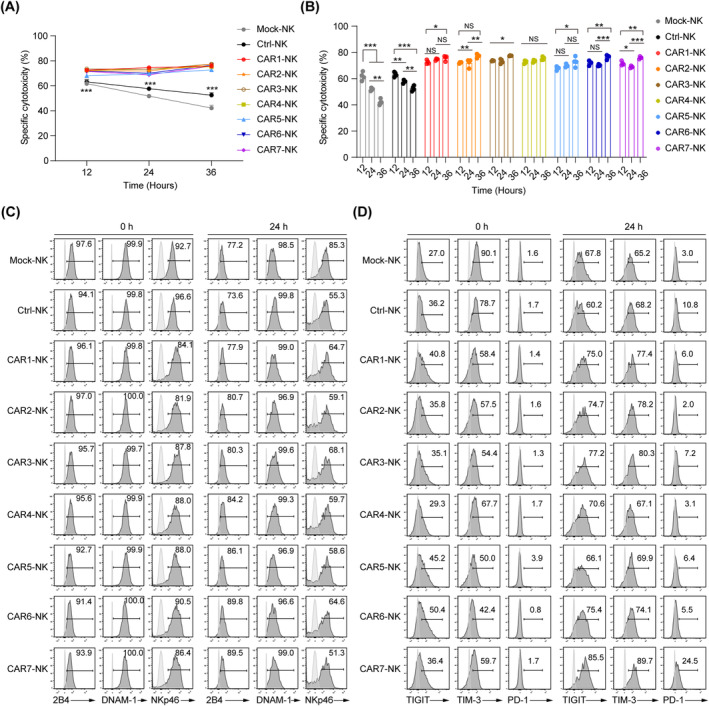
Sustained cytotoxicity and molecular features in seven CD19 CAR‐NK cells across multiple rounds of killing. (A, B) Cytotoxicity analysis of three consecutive rounds of Nalm‐6 cell killing of the CAR‐NK cells (n = 4 per group). Mock‐NK, Ctrl‐NK and seven groups of CAR‐NK cells were respectively co‐cultured with Nalm‐6 cells for 12 h per round at the E:T ratio of 1:1. The fresh Nalm‐6 cells were added to the NK cell residues incubated every other 12 h. Specific cytotoxicity was calculated using the formula: (percentage of specific death − percentage of spontaneous death) × 100. Statistics: one‐way ANOVA and Kruskal–Wallis tests, ***p < 0.001, **p < 0.01, *p < 0.05, NS, not significant. Round 1, round 2 and round 3, Ctrl‐NK versus CAR‐NK, p < 0.001. (C, D) Flow cytometric analysis of NK cell activation (2B4, DNAM‐1 and NKp46) (C) and exhaustion markers (TIGIT, TIM‐3 and PD‐1) (D) before and after two rounds of killing. Unstained control is indicated in open histograms. ANOVA, analysis of variance; CAR, chimeric antigen receptor; NK, natural killer.