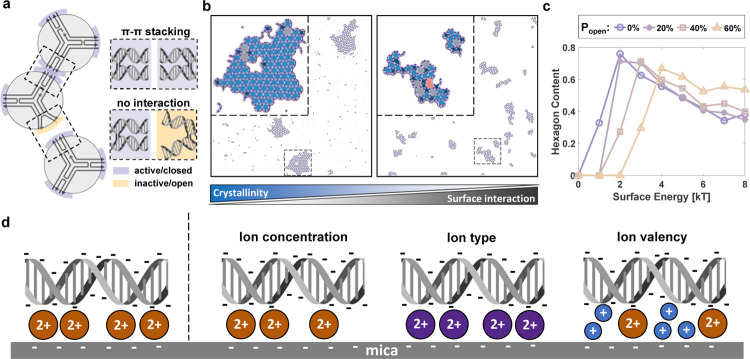
Figure 1.
Impact of surface interaction energy. (a) Schematic representation of a patchy-particle model. If two active patches (purple) of adjacent particles overlap, the two particles attract each other. However, if one of the patches is inactive (yellow), mirroring the real-life scenario of DNA helices in an arm not being parallel, there is no interaction with the adjacent particle. Gray region is the repulsive core, preventing the overlap of particles. (b) Simulation frames where Popen is 0.2 and the surface interaction energies are 2 kT (left) and 4 kT (right). Zoomed-in region with polygon overlays is also presented. Dark blue, blue, gray, and pink represent pentagon, hexagon, heptagon, and octagon, respectively. As the surface interaction energy increases, we observe a decrease in the crystallinity and radiality. (c) Average hexagon content as a function of surface energy. Reported values are averages of 10 randomly selected frames after the convergence of simulations. Simulation parameters are σ = 1, δ = 0.038, θpw = 0.3, and ε = 6 kT. Parameters are selected to represent the π–π stacking interactions between 3PS tiles.8 (d) Three ways to tune DNA-mica interaction strength (from left to right): through tuning the concentration of the divalent cation, using a distinct divalent cation that interacts with mica and DNA differently, and adding monovalent cations to compete with the divalent cation. DNA helices are drawn using DNA helix drawer.25

