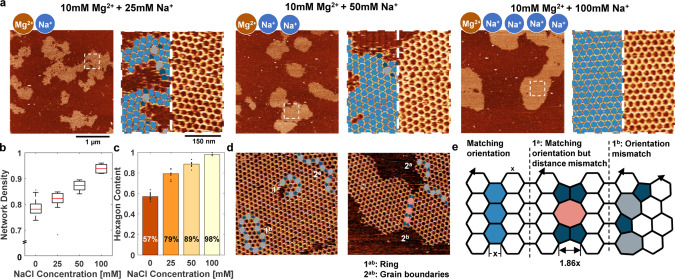
Figure 3.
Tuning the DNA-mica interaction through ion valency. (a) AFM images of the steady-state networks formed at different Na+ concentrations. Na+ concentrations were tested up to 100 mM, as higher concentrations led to a significant reduction in DNA monomer adsorption on the mica surface, indicating less favorable conditions for adsorption. For each concentration (on the left), an area of 3 μm × 3 μm and (on the right) higher magnification and overlay of the polygon identification algorithm (pentagons, dark blue; hexagons, blue; heptagons, light gray; octagons, pink). (b) Weighted mean of the network density as a function of Na+ concentration. For each condition, at least 12 images with an area of 1.5 × 1.5 μm were analyzed. Red lines indicate the median. Outliers, defined as data points beyond 1.5 times the interquartile range, are represented as individual points. (c) Weighted mean of the hexagon content as a function of the Na+ concentration. Each point represents the hexagon content recorded within a 1.5 μm × 1.5 μm area. For each condition, at least 12 images were analyzed. (d) Typical defects that we observed in the steady-state networks (highlighted on AFM images). Formation of ring defects is discussed further in Figure S6. (e) Schematic representation of different grain boundaries. If two grains align perfectly, then the grains can emerge without formation of any defects. If the crystal orientation is the same for two grains but the gap between them is not matching, then a grain boundary with a repeating unit of two pentagons and an octagon forms. However, because the grains do not have the same orientation, they tend to form a grain boundary with a repeating unit of a pentagon and a heptagon. z-range was adjusted slightly for optimal data presentation.

