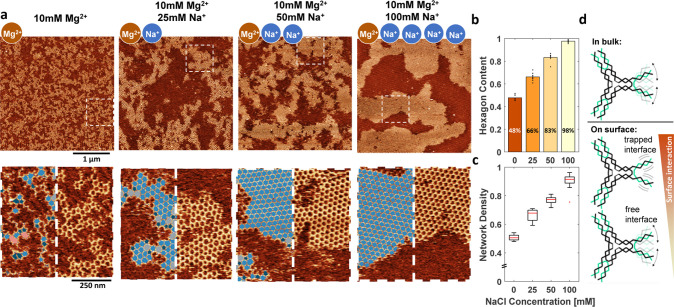
Figure 4.
Influence of the interface mobility. (a) AFM images of the steady-state networks formed at 10 mM Mg2+ and various Na+ concentrations. For each concentration (on top), an area of 3 μm × 3 μm and (bottom) higher magnification and overlay of the polygon identification algorithm (pentagons, dark blue; hexagons, blue; heptagons, light gray; octagons, pink). z-range was adjusted slightly for optimal data presentation. (b) Weighted mean of the hexagon content as a function of the Na+ concentration. Each point represents the hexagon content recorded within a 1.5 μm × 1.5 μm area. For each condition, at least 8 images were analyzed. (c) Weighted mean of the network density as a function of Na+ concentration. For each condition, at least 8 images with an area of 1.5 μm × 1.5 μm were analyzed. Red lines indicate the median. Outliers, defined as data points beyond 1.5 times the interquartile range, are represented as individual points. (d) In bulk solution, 3PS interfaces are highly mobile and can assume many conformations. When the degree of freedom is lowered due to adsorption on a surface, the mobility of this interface is heavily dependent on the strength of the interaction with the surface. If the interaction is strong, then the interface may be trapped in inactive/open states. On the other hand, if the interaction is weak, the high mobility of the interface may make the interface flexibility less important since the speed of interface movement may surpass the speed of 3PS diffusion.

