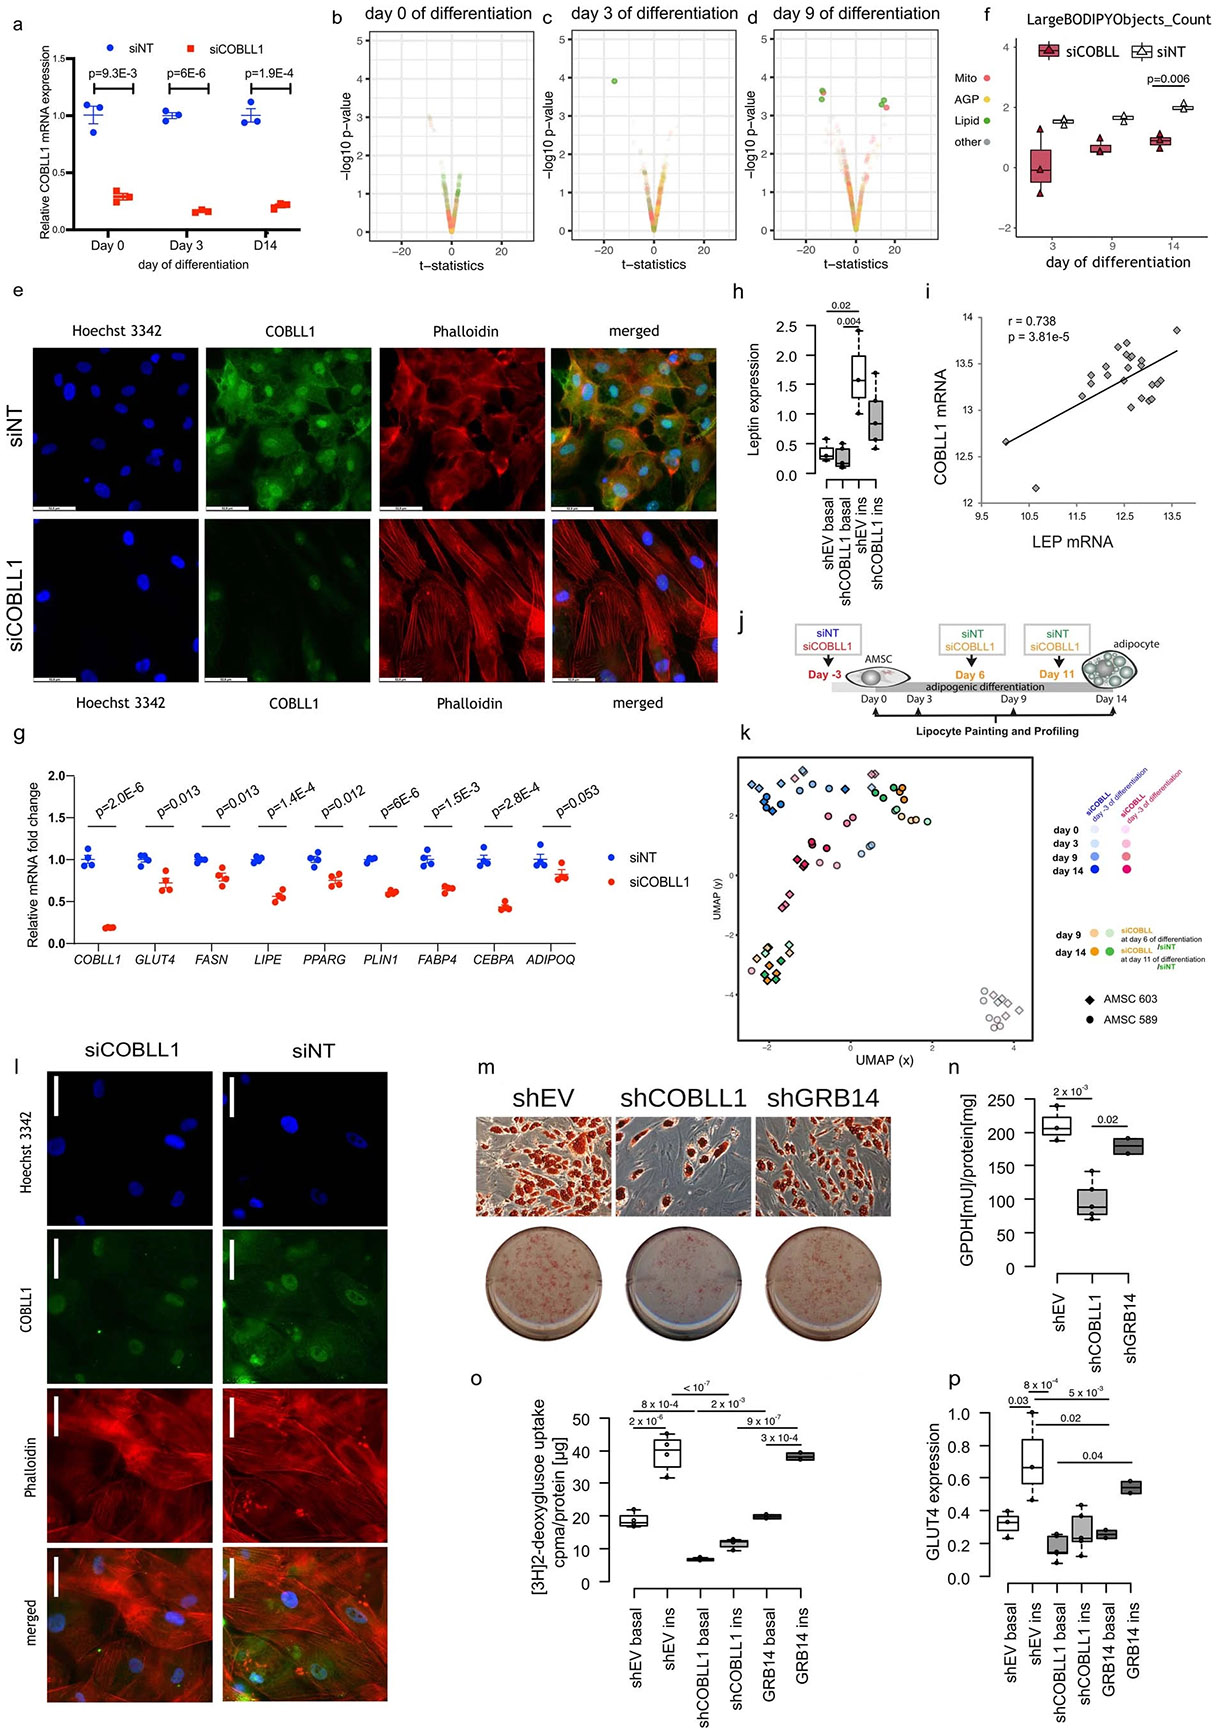
Extended data Fig. 5 ∣. Knockdown of COBLL1 affects actin remodeling processes in differentiating adipocytes along with adipocyte differentiation insulin sensitivity and lipolysis rate.

(a) COBLL1 expression in siCOBLL1 and siNT at day 0, 3 and 14 of differentiation, N = 3 biologically independent experiments, t-test two-sided. knock-down efficiency 80%, mean values + SEM. (b–d) Morphological profiles of siCOBLL compared to siNT AMSCs at day 0 (b) day 3 (c) and day 9 (d) of differentiation, t-test two-sided, significance level < 5%FDR. (e) Actin and COBLL1 staining in siCOBLL1 compared to siNT subcutaneous adipocytes at day 9 using phalloidin and COBLL1 antibody staining (HPA053344, Alexa-Fluor 488), magnification x63/oil. Scale bar = 52.8 um. Representative results from N = 3 independent experiments. (f) Cells_Children_ LargeBODIPY_objects_count in siCOBLL1- and siNT AMSCs at day 3, 9, 14, N = 3 biologically independent experiments, t-test two-sided, significance level < 5% FDR. (G) qPCR-based gene expression of COBLL1 and adipocyte marker genes GLUT4, FASN, LIPE, PPARG, PLIN1, FABP4, CEBPA, ADIPOQ in siCOBLL1 and siNT AMSCs at day 14 of differentiation, t-test two-sided, N = 4 biologically independent experiments, mean values +/− SEM. (h) qPCR-based leptin gene expression in shCOBLL1 compared to shEV adipocytes. Data are represented as median + 95% CI, one-way ANOVA with Tukey’s HSD test, N = 4 biologically independent experiments (i) Correlation of COBLL1 mRNA with LEP mRNA in subcutaneous adipose tissue from 24 lean individuals measured by Illumina microarrays. The pearson’s correlation coefficient r and p-value are depicted (j) Schematic of siCOBLL1 KD and AMSCs differentiation. (k) UMAP-based dimensionality reduction of LipocyteProfiler features in siCOBLL1 and siNT AMSCs. (l) Actin and COBLL1 staining in siCOBLL1 and siNT visceral adipocytes at day 14 using phalloidin and COBLL1 antibody staining (HPA053344, Alexa-Fluor 488), magnification x63/oil. Representative result from N = 2 independent experiments, scale bar = 52,8um (m) Representative Oil-Red-O lipid staining in SGBS adipocytes following lentiviral COBLL1 knock-down (shCOBLL1, knock-down efficiency 69%) and GRB14 (shGRB14, knock-down efficiency 61%) compared to empty vector control (shEV), scale bar = 15 mm. (n) GPDH metabolic activity in shCOBLL1, shGRB14 and shEV SGBS adipocytes, one-way ANOVA with Tukey’s HSD test, mean + 95% CI, N = 4 biologically independent experiments (o) Basal and insulin-stimulated 3H-2-deoxyglucose uptake in shCOBLL1, shGRB14 and shEV SGBS adipocytes, one-way ANOVA with Tukey’s HSD test, mean + 95% CI, N = 4 biologically independent experiments, 1st and 3rd quartiles (box) and median (middle line) are indicated, p = 4.3 × 10⁻⁸. (p) qPCR-based GLUT4 gene expression in shCOBLL1, shGRB14 and shEV adipocytes, one-way ANOVA with Tukey’s HSD test, mean + 95% CI, N = 4 biologically independent experiments.
