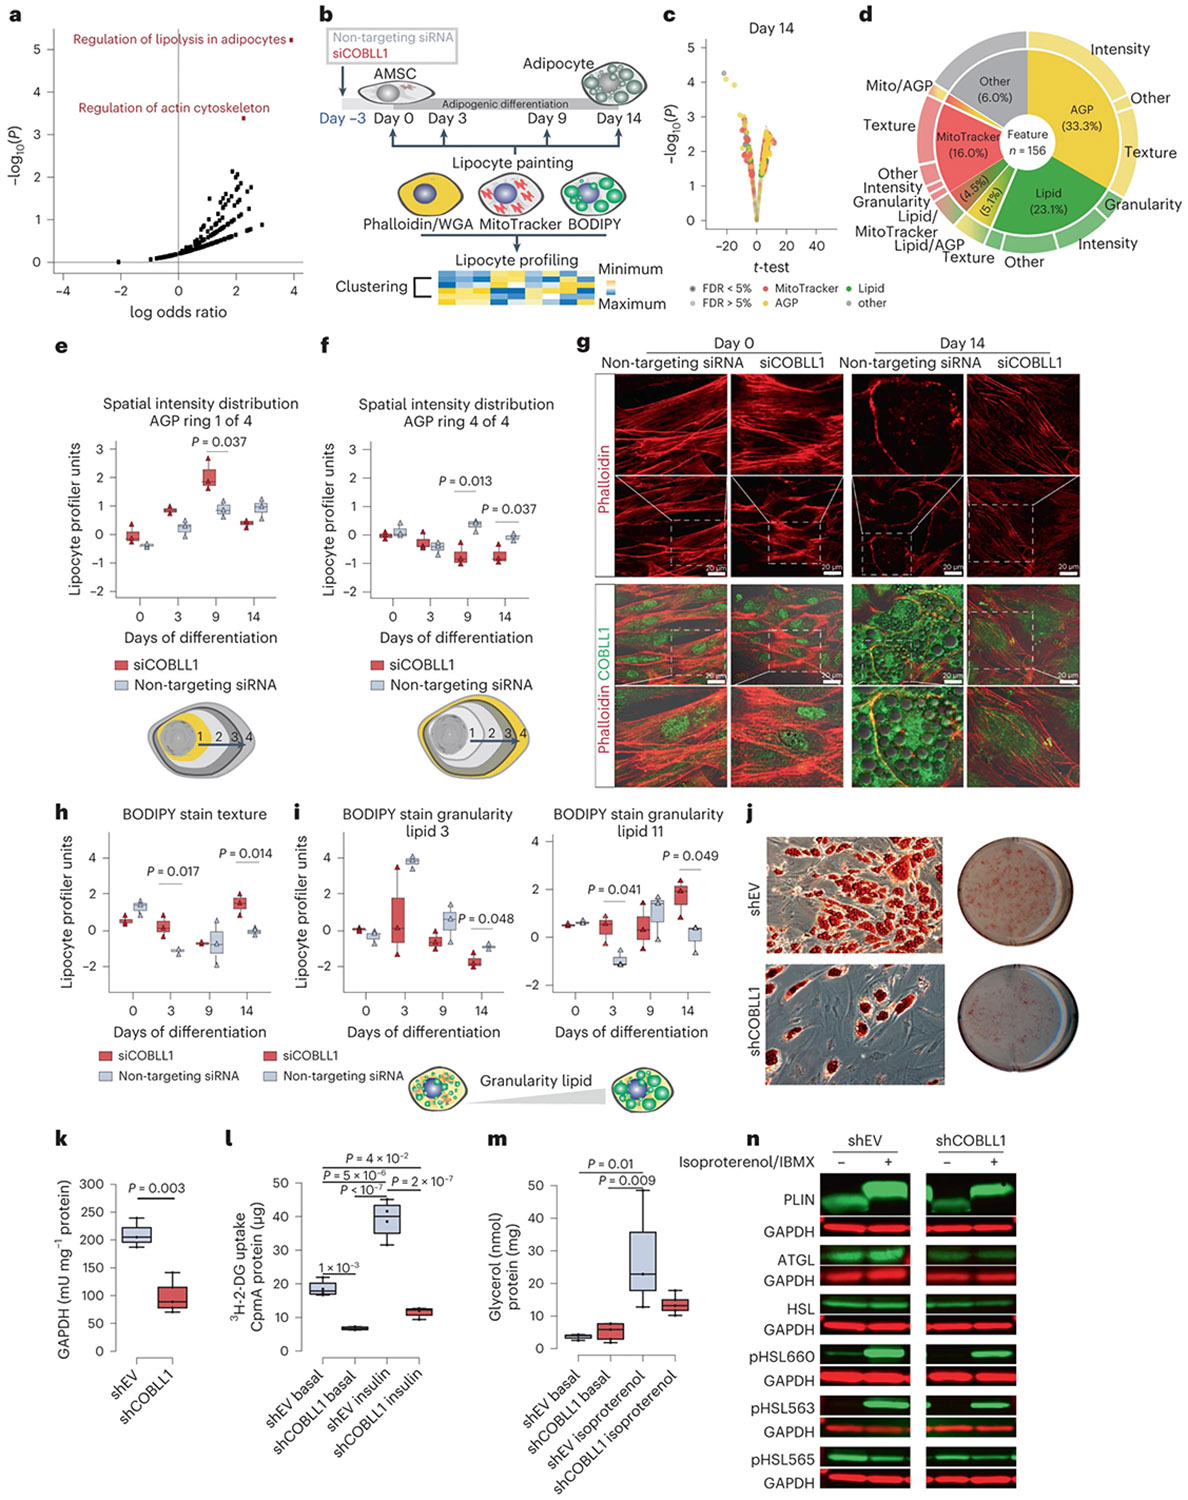
Fig. 3 ∣. The 2q24.3 effector gene COBLL1 affects actin remodelling processes in differentiating adipocytes.

a, Kyoto Encyclopedia of Genes and Genomes (KEGG) pathway enrichment of genes correlated with COBLL1 in adipocytes using Enrichr89,90. n = 30 donors, P values were derived from a hypergeometric test. b, Schematic of siCOBLL1 experiments in AMSCs across differentiation. AMSCs from a normal-weight female donor were silenced 3 d before induction and LipocyteProfiling (days 0, 3, 8 and 14 of differentiation), n = 3. c, Image-based profiles of siCOBLL1-treated compared to non-targeting siRNA-treated AMSCs on day 14; two-sided t-test, significance level FDR < 5%, n = 3. d, Pie chart illustrating differential features per channel and measurement class comparing siCOBLL1 and the non-targeting siRNA control on day 14. e,f, Spatial intensity distribution of AGP informative for the actin cytoskeleton in the centre of the cytoplasm: Cytoplasm_RadialDistribution_FracAtD_AGP_1of4 (e) and juxtaposed to the plasma membrane (Cytoplasm_RadialDistribution_RadialCV_AGP_4of4) (f). Two-sided t-test, n = 3 biologically independent experiments, median ± 95% confidence interval (CI). g, Representative images of COBLL1 knockdown and non-targeting siRNA control at days 0 and 14 of differentiation. COBLL1 staining: anti-COBLL1 primary and donkey anti-rabbit IgG H&L secondary antibodies. Actin staining: phalloidin–Atto 565. Olympus FLUOVIEW FV1000 CLSM Inverse microscope (40× magnification). Images were processed with Image J. Dotted square: image zoom-in. h,i, Texture of BODIPY stain (Cells_Texture_Correlation_Lipid_10_01) (h) and granularity measures of the BODIPY stain (Cells_Granularity_3_BODIPY) (i) in siCOBLL1 knockdown and non-targeting siRNA; two-sided t-test, n = 3 biologically independent experiments, median ± 95% CI.j, Oil Red O staining in SGBS adipocytes after stable lentiviral COBLL1 knockdown (shCOBLL1) versus empty vector control (shEV); scale bar, 15 mm. k, GPDH metabolic activity in differentiated shCOBLL1 compared to non-targeting siRNA adipocytes. Paired Student’s t-test, median ± 95% CI, n = 3. l, Basal and insulin-stimulated 3H-2-DG uptake in differentiated shCOBLL1 compared to shEV adipocytes. One-way analysis of variance (ANOVA) with Tukey’s honestly significant difference (HSD) test, median ± 95% CI, n = 3 biologically independent experiments. m, Basal and isoproterenol-stimulated lipolysis rate measured using glycerol release in differentiated shCOBLL1 compared to shEV adipocytes. One-way ANOVA with Tukey’s HSD test, median ± 95% CI, n = 3 biologically independent experiments. n, Western blots for lipolysis-relevant proteins assayed in basal or isoproterenol/IBMX-stimulated shCOBLL1 versus shEV adipocytes (n = 2).
