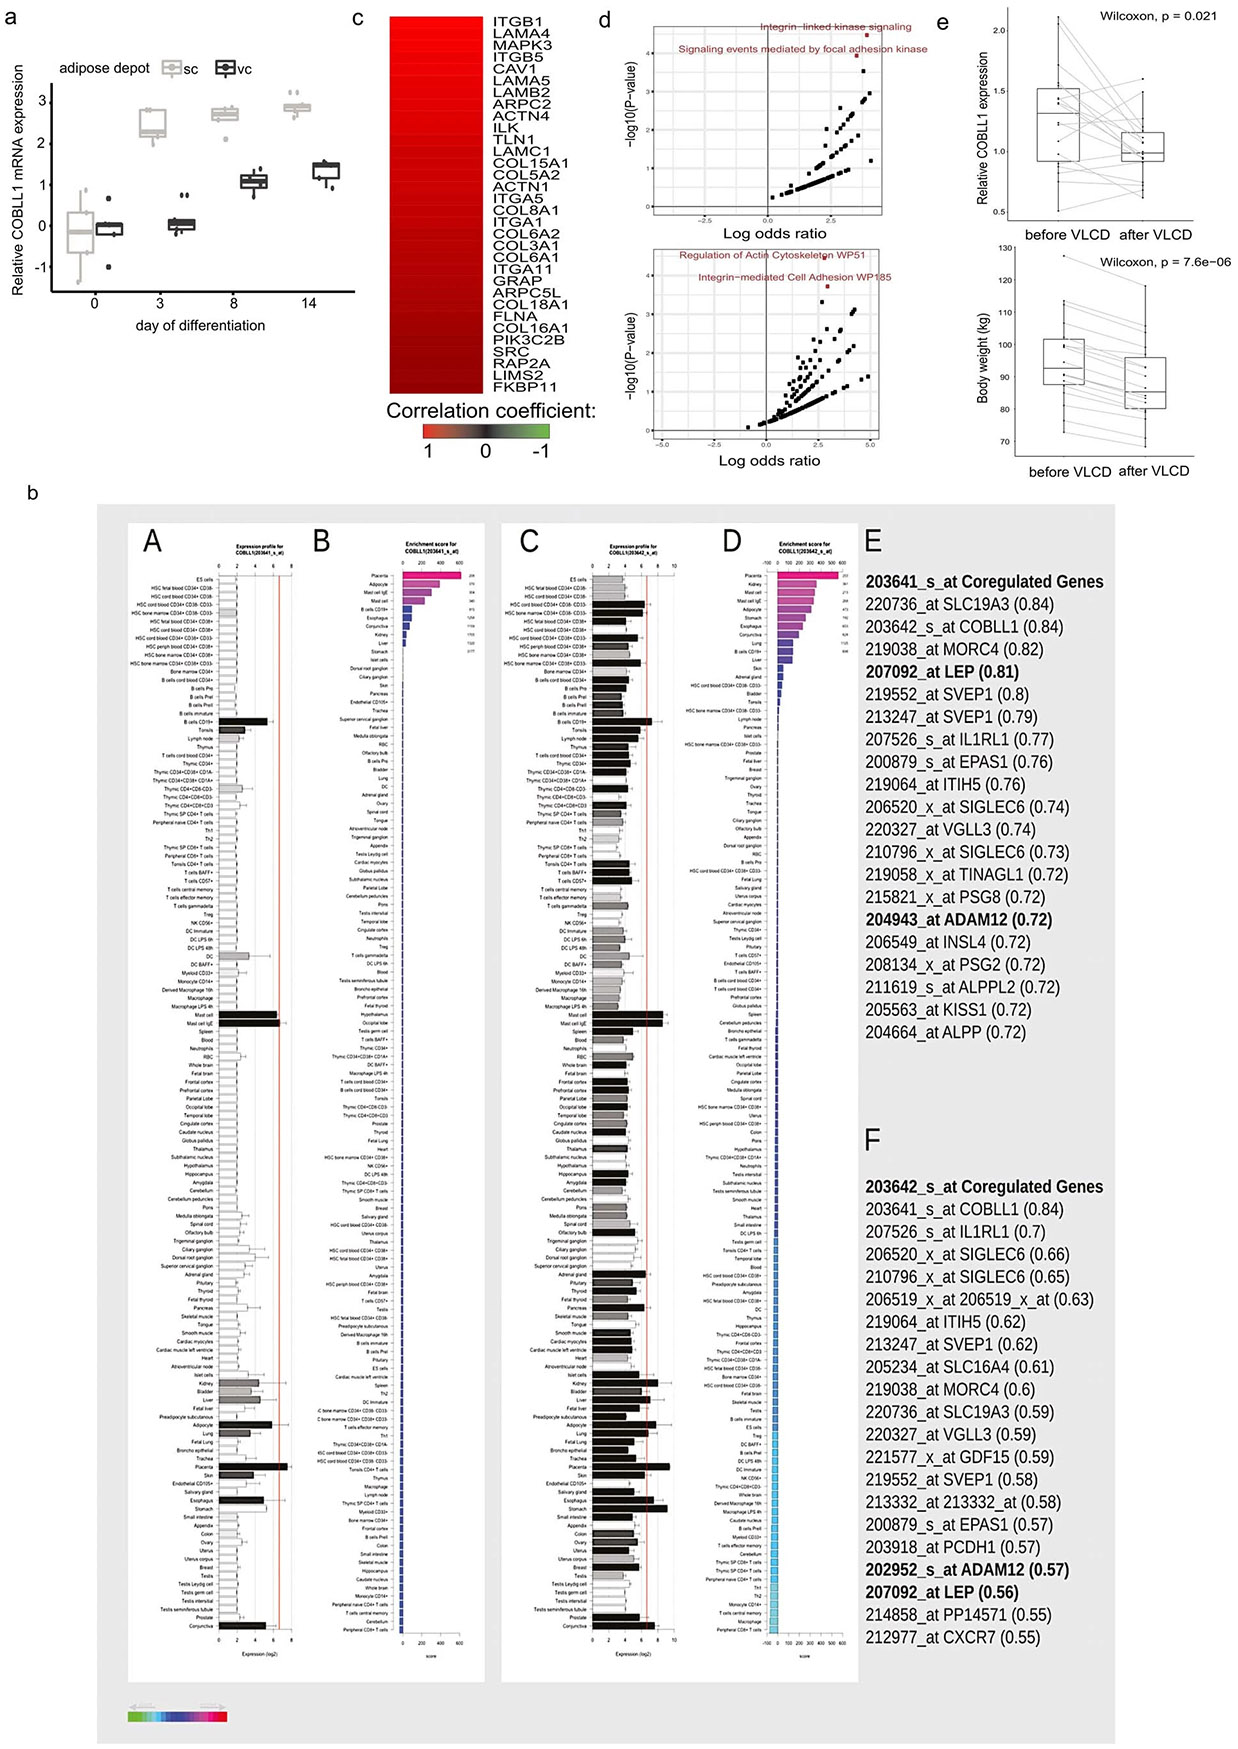
Extended data Fig. 4 ∣. COBLL1 regulates actin cytoskeleton remodeling.

(a) COBLL1 expression in subcutaneous and visceral AMSCs throughout adipogenic differentiation, N = 4 biologically independent experiments, t-test two-sided, data represent median + 95% CI. (b) COBLL1 gene expression enrichment across 142 tissues (A-D) from enrichment profiler36. COBLL1 probes 203641_s_at and 203642_s_at were used for coregulation analysis (E-F). (c) Correlation with COBLL1 probe ILMN_1761260 using microarray data from lean and individuals with obesity. (d) Enrichment of pathways in the HCI (upper panel) and WikiPathways (lower panel) gene set lists from Enrichr, plotted as in Fig. 3A (KEGG), with p-value thresholds corresponding to the FDR cutoffs in those data. p-values are derived from a hypergeometric test. (e) COBLL1 expression in subcutaneous adipose tissue before and after a very low caloric diet (VLCD, upper panel, n = 18), corresponding body weight (lower panel), Wilcoxon signed-rank test.
