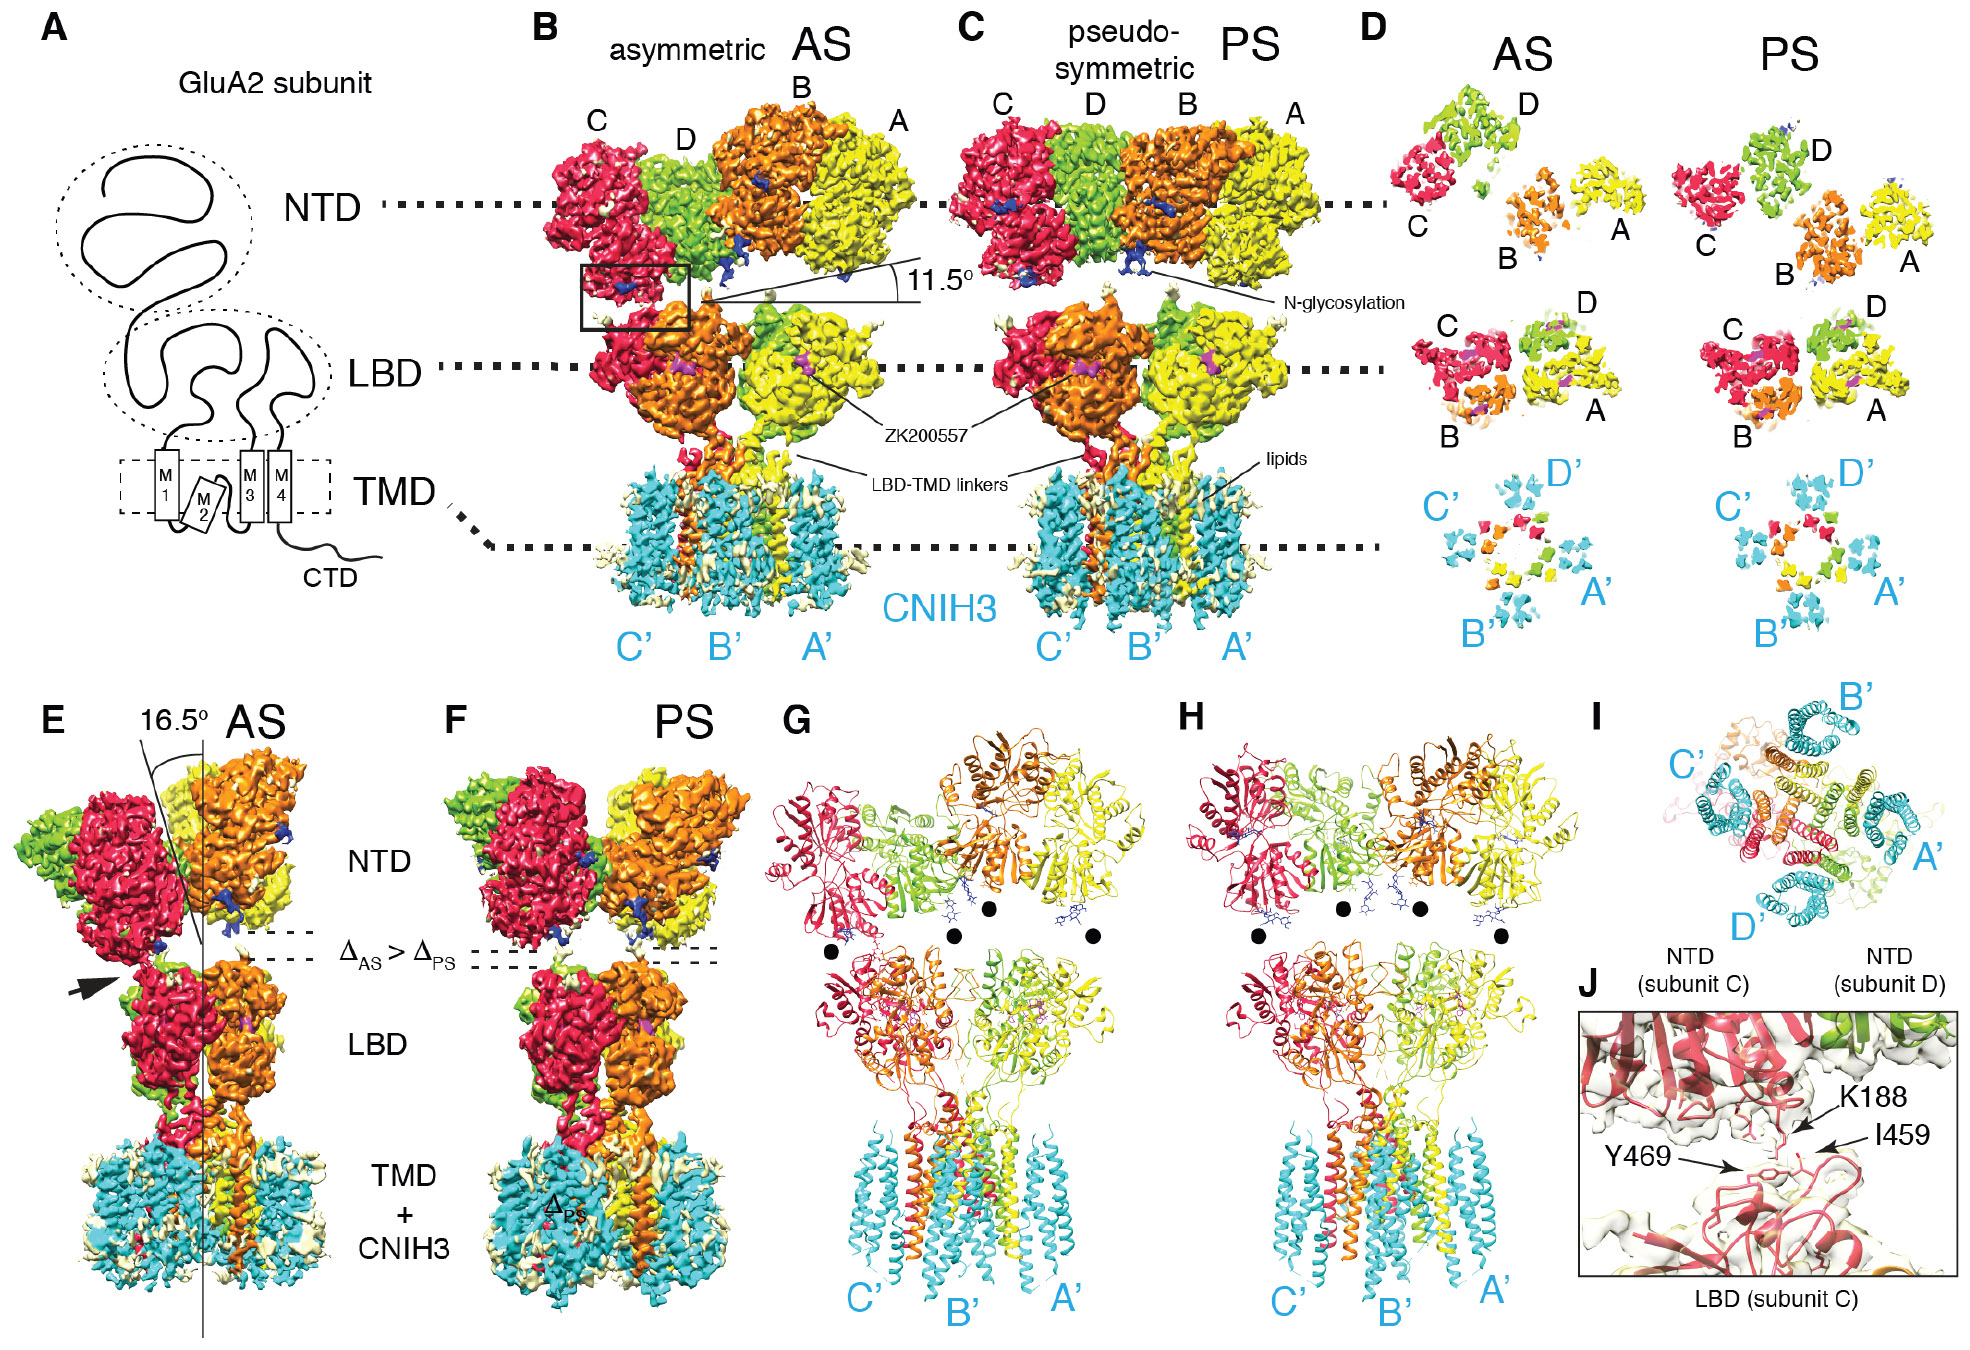
Fig. 1. Cryo-EM structures of the complex formed of GluA2 and CNIH3 (A2-C3).

A. Domain organization of a GluA2 subunit.
B-C. Density map of A2-C3 in AS and PS. From this view the NTD layer is tilted by 11.5° in AS. No symmetry was imposed in solving AS, whereas C2 was imposed for PS. Visualizing thresholds: NTD(AS) at 7.07σ, TMD-LBD-C3(AS) I at 7.56σ, NTD(PS) at 7.32σ, TMD-LBD-C3(PS) at 6.80σ. Overall resolutions: NTD(AS)=3.1Å, LBD-TMD-C3(AS) I=3.5Å, NTD(PS)=3.1Å, LBD-TMD-C3=3.2Å. See TableS1 and FigS3-8 for detailed description of each map.
D. Cross sections of each domain indicated by dashed lines, viewed from the top (the NTD side). The subunits of tetrameric GluA2 are referred to as A (yellow), B (orange), C (red), and D (green). The cyan densities are CNIH3, named A’-D’ based on location, following the style used for TARPs (16, 25).
E-F. Side views of maps shown in B and C. The tilt angle of the NTD layer (16.5°), the NTD-LBD contact (arrow head), gaps between NTD and LBD (ΔAS, ΔPS) are indicated.
G-I. Molecular models of A2-C3 in AS and PS are shown as ribbon diagrams. Models were built from maps NTD(AS), LBD-TMD-C3(AS)II, NTD(PS), and LBD-TMD-C3(PS) (TableS1). Black dots indicate glycosylation at N241. Bottom view I.
J. Zoomed in view of the NTD-LBD contact in C subunit indicated as a rectangle in B. Model and map (NTD(AS) at 7.07σ) are superimposed.
