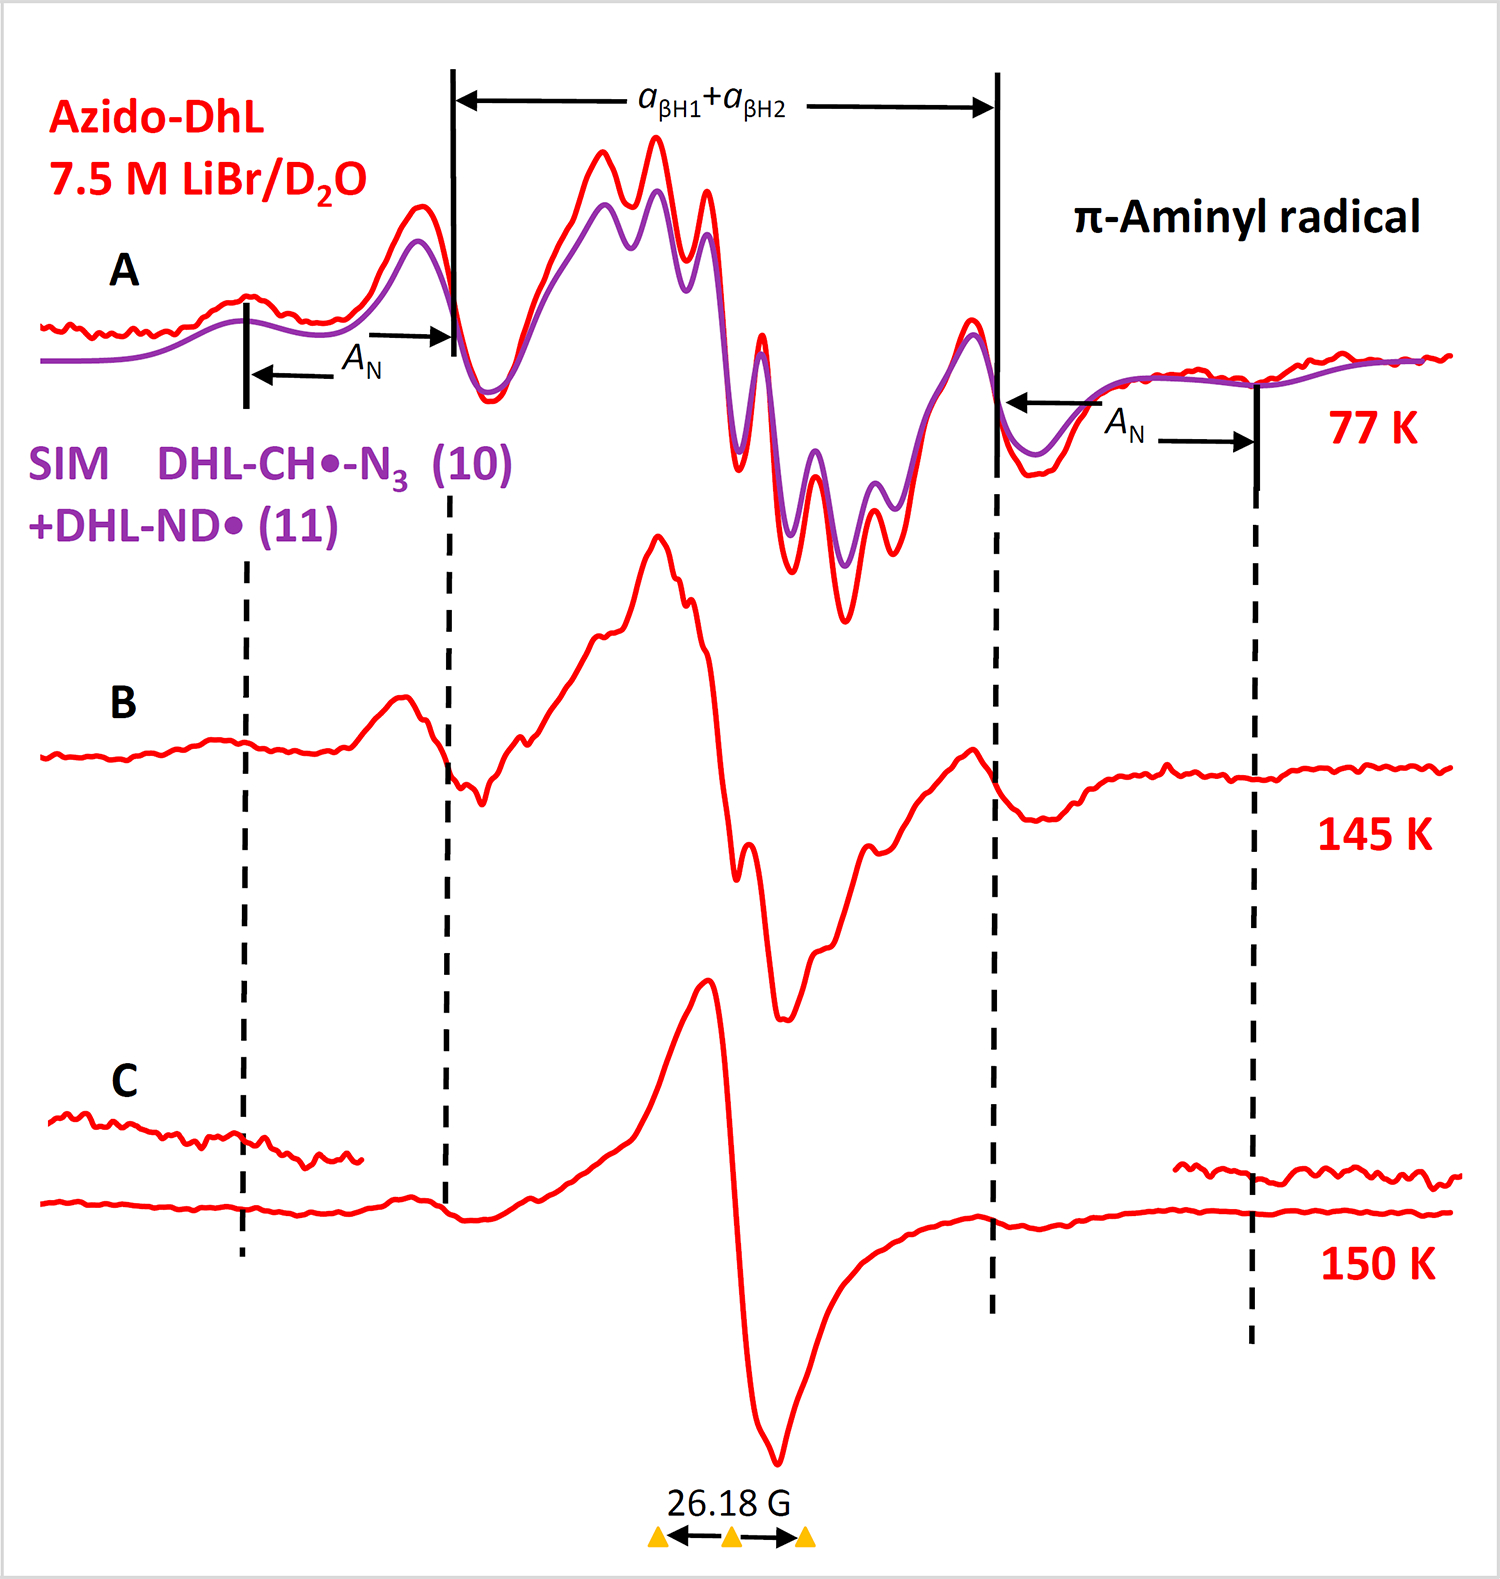
Figure 10.

(A) ESR spectrum (red) after radiation-produced one-electron addition to AzDhL 4 (2.0 mg/mL) at 77 K (γ-irradiation, 500 Gy) in 7.5 M LiBr/D2O in dark; the violet spectrum is the combination of the simulated spectra of radicals 10 and 11 respectively (for simulation details including parameters see SI section; Figure S5 and S7–S9). Spectra shown in B and C were obtained via stepwise warming of the sample for 15 min at ca. 145 K and at ca. 150 K in the dark. The spectra at the wings in Figure C were multiplied by 5. All spectra were recorded at 77 K.
