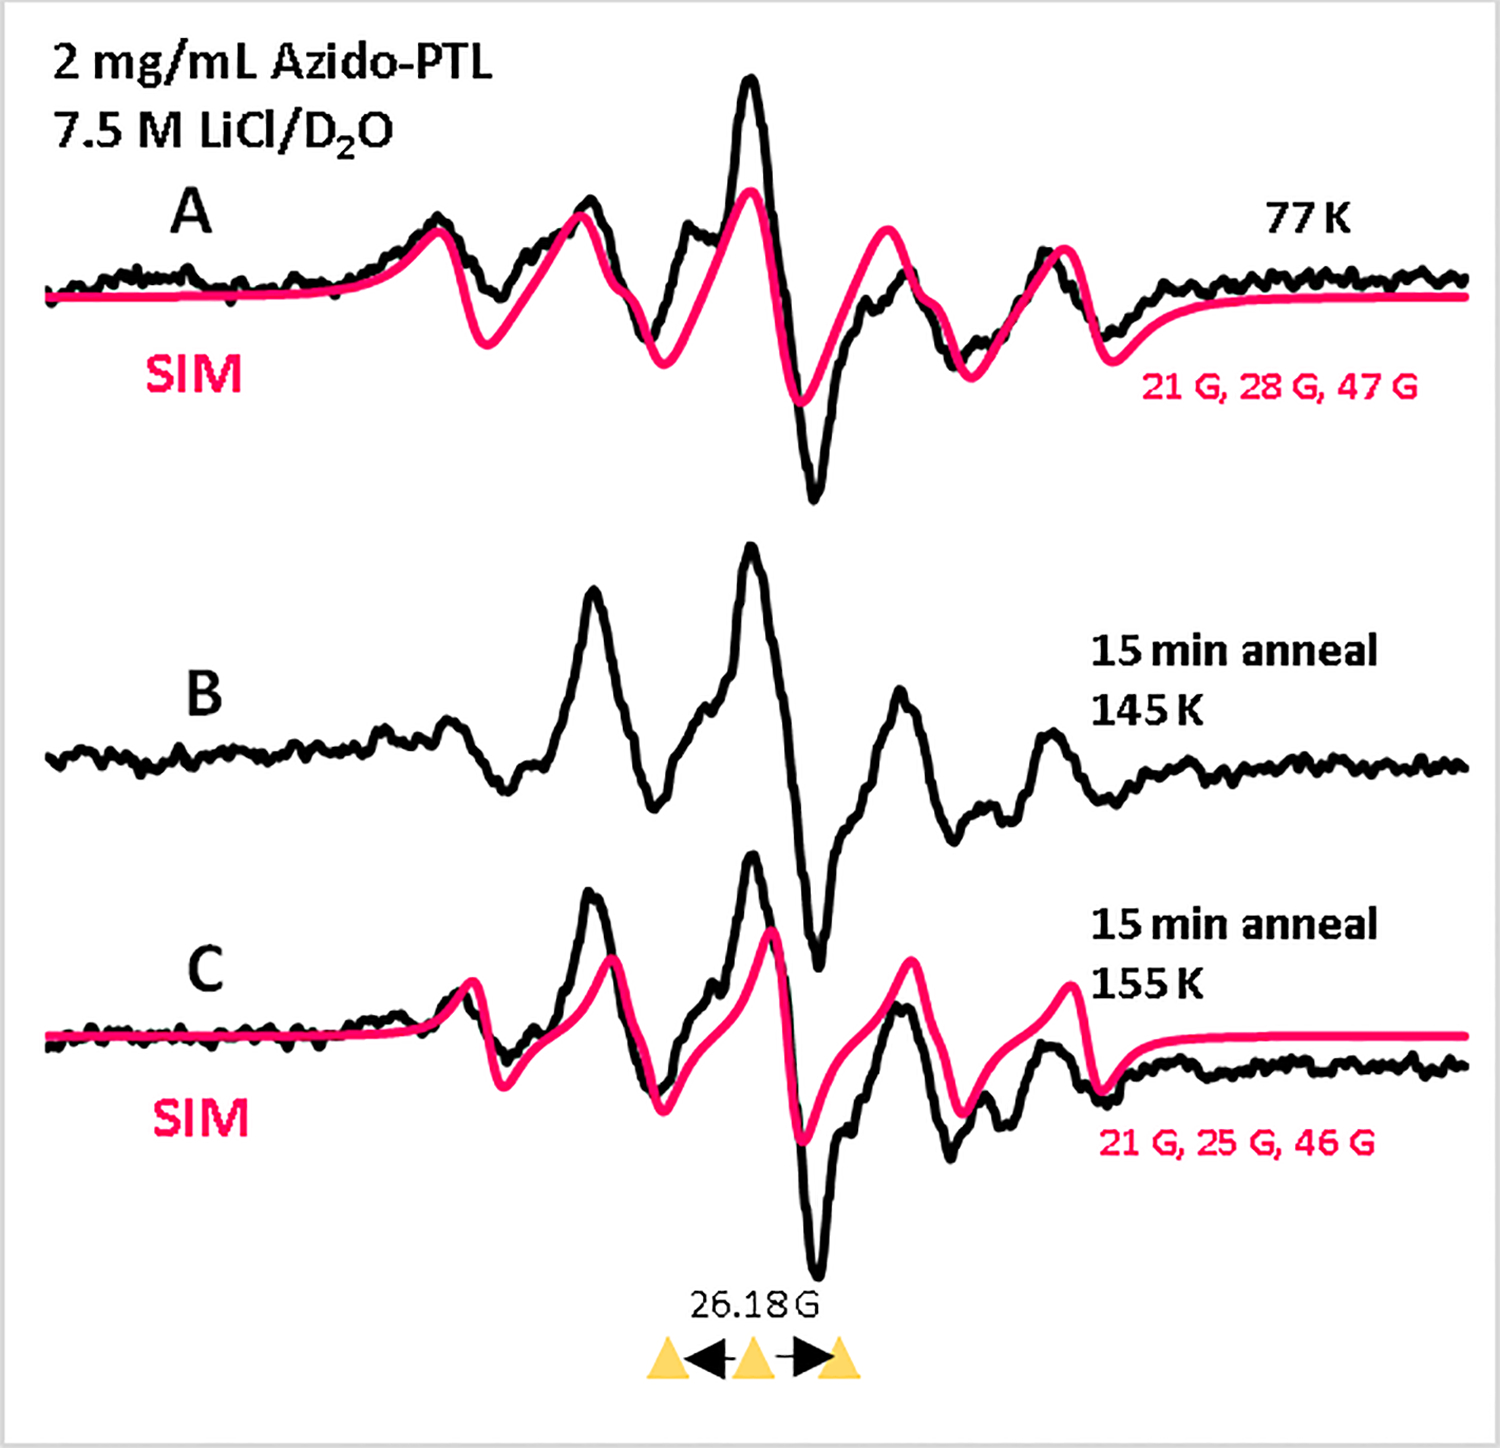
Figure 9.

ESR spectra of γ-irradiated (absorbed dose = 500 Gy at 77 K) homogeneous glassy solution of AzPTL 3 (2 mg/mL, black) in 7.5 M LiCl in D2O (A) at 77 K. Spectra A through C are assigned to radical 9 formed as depicted in Scheme 4. Spectra (B, black) and (C, black) were obtained via stepwise annealing of the sample for 15 min at ca. 145 and ca. 155 K in the dark. The black spectra in A and B were obtained after subtraction of the line components of Cl2•¯ spectrum, following our previous works,25, 27 from the individual experimentally recorded spectrum. The spectra (red) are the simulated spectra (for simulation parameters, see SI section). Three equally spaced (13.09 G) reference triangles in this Figure and in subsequent Figures show Fremy’s salt resonances with central marker at g = 2.0056.
