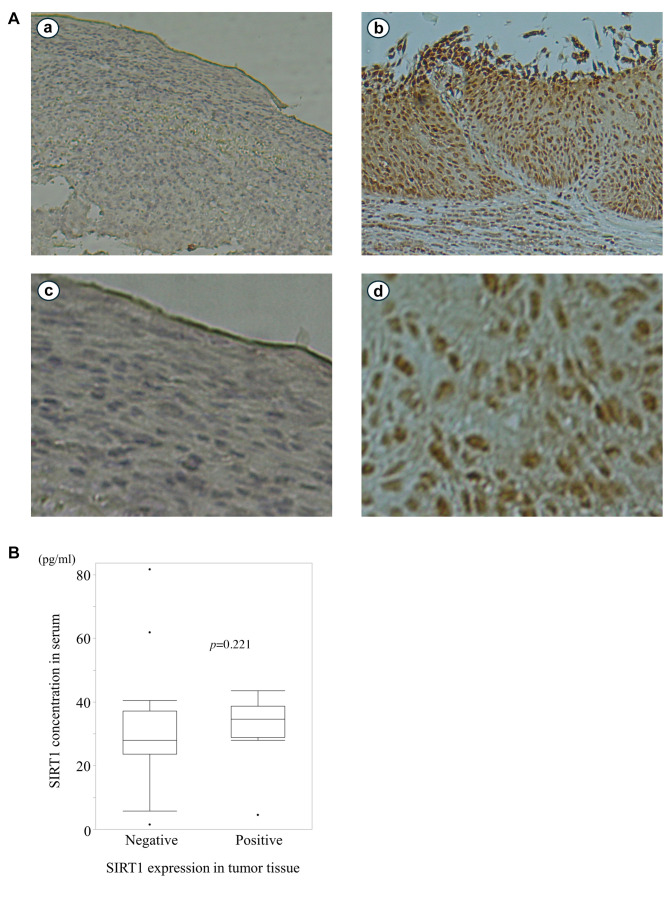
Figure 1.
Immunochemical images and correlation between serum and tissue SIRT1 expression. (A) Immunohistochemical images of sirtuin 1 (SIRT1) expression in tissue. Images of low expression (a and b) and high expression (c and d) are shown (100× in the upper section, 400× in the lower section). (B) Correlation between serum SIRT1 concentration and SIRT1 tissue expression in the surgical specimens.

