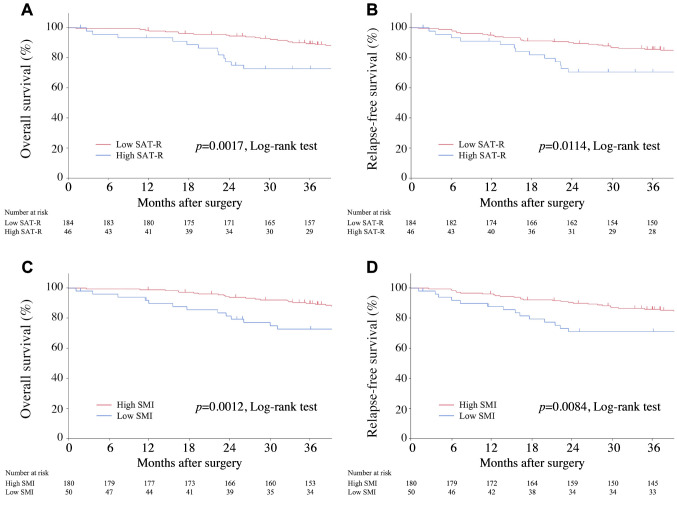
Figure 2.
Kaplan–Meier overall survival (OS) and recurrence-free survival (RFS) curves according to subcutaneous adipose tissue radiodensity (SAT-R) radiodensity and skeletal muscle index (SMI). Kaplan–Meier OS curves according to SAT-R (A) and SMI (C). Kaplan–Meier RFS curves according to SAT-R (B) and SMI (D). OS and RFS were significantly worse in the high SAT-R and low SMI groups than in the other groups.

