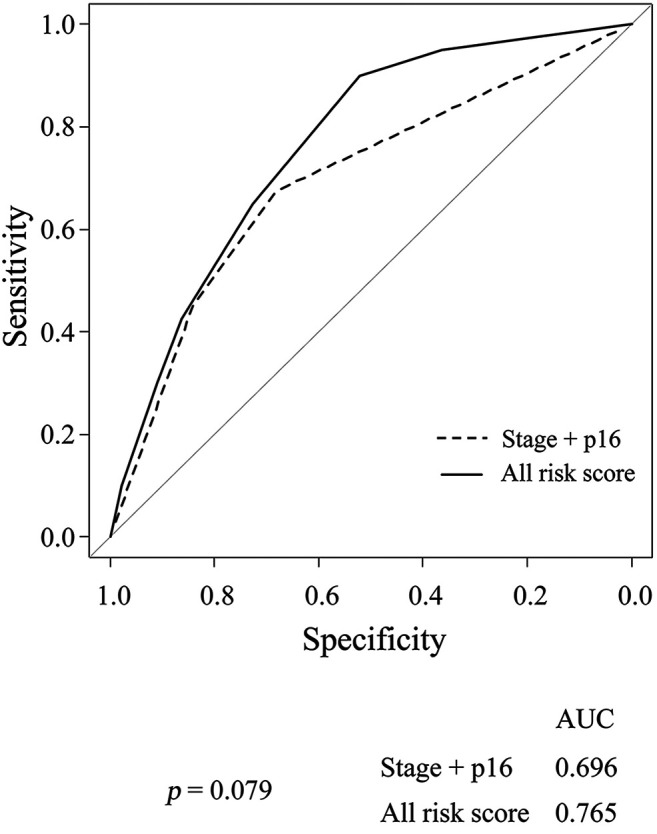
Figure 5.

The ROC curves of prediction for overall survival. A dotted line indicates ROC curve for combinations of clinical parameters (Stage and p16 status). A solid line shows ROC curve for combinations of all parameters (Stage, p16 status, BMI, CONUT score, and CD8 positivity).
