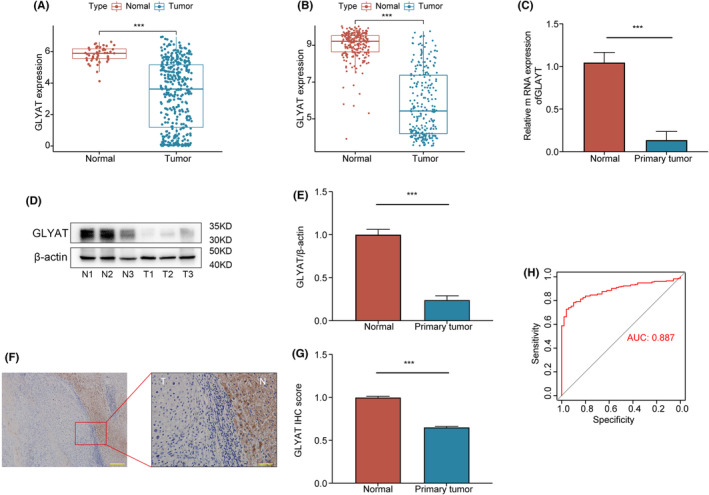
FIGURE 1.

Expression of GLYAT and its diagnostic value in HCC patients. (A, B) The mRNA expression of GLYAT in HCC and paired normal tissues was analysed based on the TCGA and GEO databases. (C–G) RT‐qPCR, Western blotting and IHC were used to analyse the GLYAT expression in fresh HCC tissues and corresponding normal tissues. T, tumour; N, normal. (H) Diagnostic value of GLYAT downregulation for HCC using ROC curve. ***p < 0.001. Scale bars for F are 200 and 50 μm.
