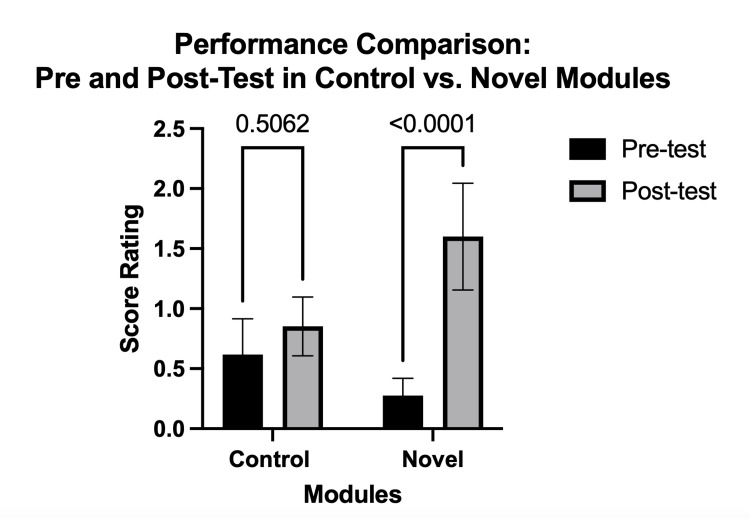
Figure 3. Performance before and after the module.
Comparison of the performance of student doctors assessed through pre- and post-test scores, comparing those who participated in control modules against those who engaged with novel instructional modules. The bar graphs show the quantification. Results are shown as mean ± standard error of the mean (SEM) (n = 74).

