
Figure 2.
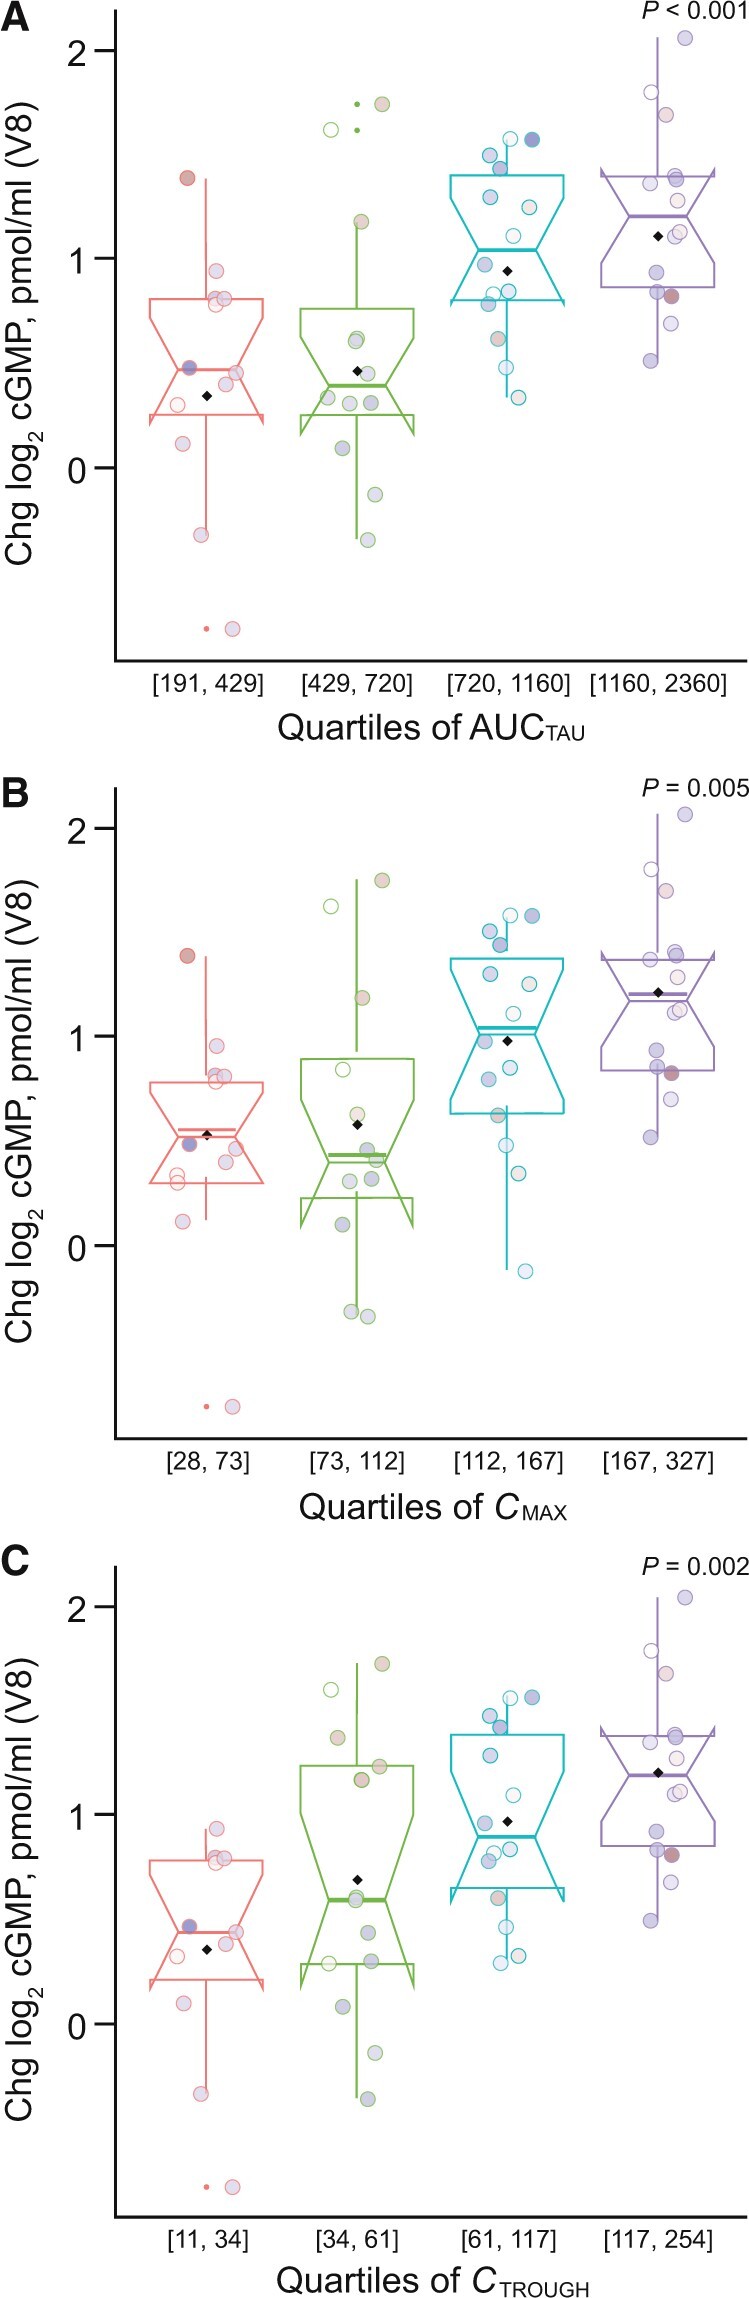
Changes in plasma cGMP to week 14 in riociguat arm by week 14 riociguat concentration quartiles. (A) AUCTAU, (B) CMAX, and (C) CTROUGH. AUCTAU: area under the plasma concentration−time curve. cGMP: cyclic guanosine monophosphate; Chg: change; CMAX: maximum plasma concentration; CTROUGH: trough plasma concentration; V8: study visit 8 (week 14). Circles show values for individual patients. Values in parentheses on x-axes are the upper and lower limits of each quartile. Shading of data points is for visualization only. P-values were generated by exploratory t-test and are for information only.