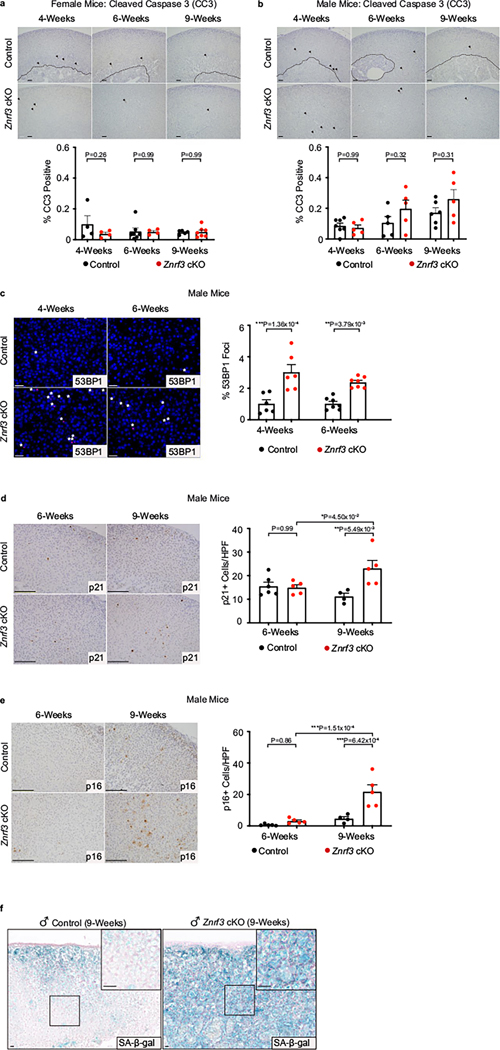
Extended Data Fig. 2 |. Znrf3 cKO adrenals activate cellular senescence during adrenal regression.
(a, b) Apoptotic cell death as measured by cleaved caspase 3 (CC3) is not significantly increased in female or male Znrf3 cKO adrenals compared to controls during the initial phase of tissue regression. Quantification of CC3-positive cells was performed using QuPath digital image analysis based on the number of positive cells and normalized to total adrenal cortex nuclei. Arrows indicate CC3-positive cells. Dashed line indicates histological boundary between adrenal cortex and medulla. Scale bars, 100 μm. (c) DNA damage as measured by 53BP1 foci is significantly increased in male Znrf3 cKO adrenals compared to controls at 4- and 6-weeks of age. Quantification of 53BP1 foci was performed using QuPath digital image analysis based on the number of positive foci and normalized to total nuclei. Asterisks indicate 53BP1-positive foci. Scale bars, 10 μm. (d) p21, (e) p16INK4a, and (f) senescence-associated beta-galactosidase (SA-β-gal) are significantly increased in 9-week male Znrf3 cKO adrenals compared to controls. Scale bars, 100 μm. Quantification of p21 and p16INK4a IHC was performed using QuPath digital image analysis based on the number of positive cells per high powered field (HPF). Representative SA-β-gal images obtained from analysis of 3 independent mice is shown. Each dot represents an individual animal. Error bars represent mean ± s.e.m. Statistical analysis was performed using two-way ANOVA followed by Tukey’s multiple comparison’s test.

