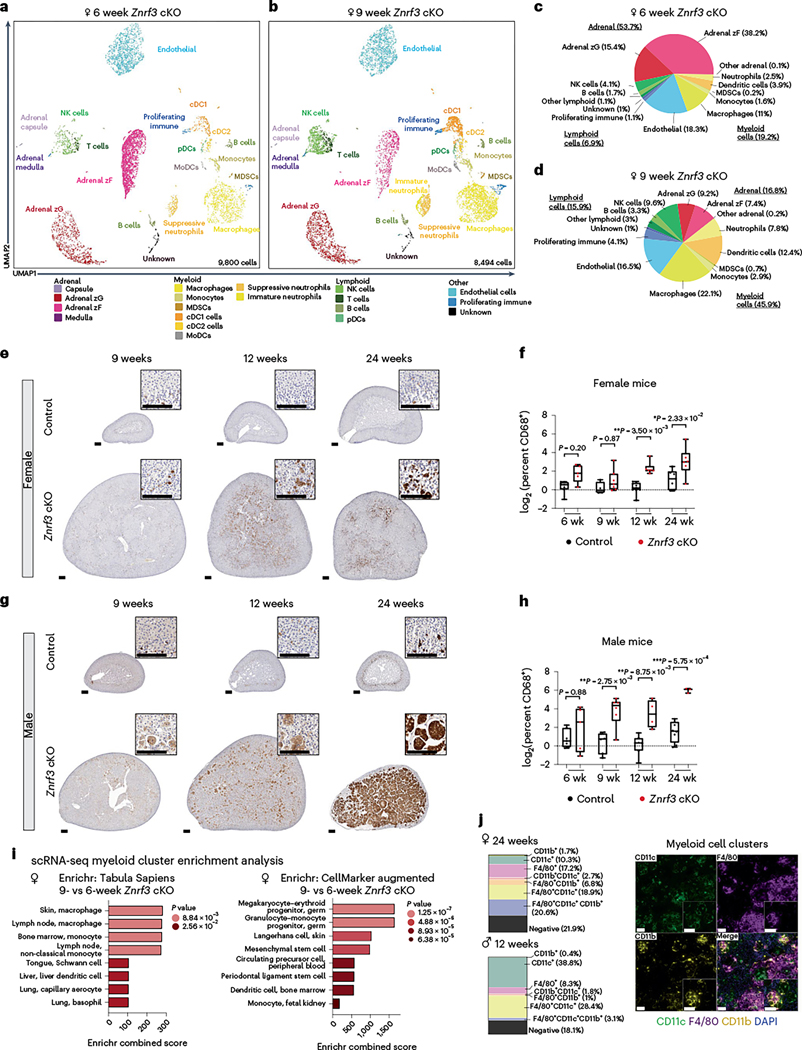
Fig. 4 |. scRNA-seq reveals activation of innate and adaptive immune systems in response to cellular senescence and the SASP.
Uniform manifold approximation and projection (UMAP) plots with cluster identification of cell types in adrenal glands of female Znrf3-cKO animals at 6 weeks (9,800 cells) (a) compared to 9 weeks (8,494 cells) (b). Adrenal zG, adrenal zona glomerulosa; adrenal zF, adrenal zona fasciculata; cDC1, conventional type 1 DC; cDC2, conventional type 2 DC; MDSC, myeloid-derived suppressor cell; MoDC, monocyte-derived dendritic cell; NK, natural killer; pDC, plasmacytoid dendritic cell. c,d, Proportions of major adrenal, myeloid, lymphoid and other populations in 6-week and 9-week Znrf3-cKO samples are visualized according to the percentage of total cells. In situ validation of myeloid cell accumulation based on IHC for CD68 in control and Znrf3-cKO adrenal tissue from female (e,f) and male (g,h) cohorts. Quantification was performed using QuPath digital analysis based on the number of positive cells normalized to total nuclei. Each dot represents an individual animal. Box-and-whisker plots indicate the median (line) within the upper (75%) and lower (25%) quartiles, and whiskers represent the range. Statistical analysis was performed on log2 transformed data using two-way ANOVA followed by Tukey’s multiple-comparison test. Scale bars, 100 μm. i, Enrichment analysis using Enrichr for myeloid cell clusters (macrophages, DCs, monocytes and myeloid-derived suppressor cells) based on significant DEGs between 9- and 6-week Znrf3-cKO mice. Combined score indicates the log (P value) × z score. Padj values are indicated for the respective color groups and were calculated using Fisher’s exact test. j, Multiplex immunofluorescence images of multi-nucleated myeloid clusters based on staining for CD11c (green), F4/80 (purple), CD11b (yellow) and 4,6-diamidino-2-phenylindole (DAPI) (blue). Images shown are from a 24-week-old female Znrf3-cKO animal and are representative of clusters observed in staining of five independent 24-week-old female Znrf3-cKO animals and four 12-week-old male Znrf3-cKO mice. Quantification was performed using QuPath digital analysis on manually annotated fused cell clusters based on the percentage of total nuclei in each cluster and are visualized as parts of a whole. Scale bars, 50 μm.

