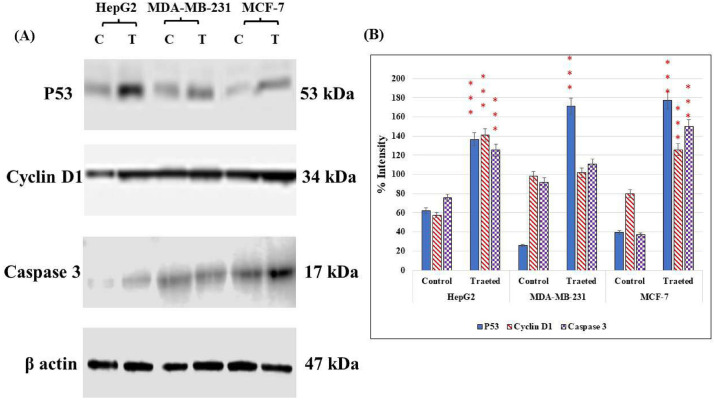
Fig 7. Immunoblotting analysis of cells treated with the methanolic extract of O. ficus-indica (L.) Mill. flowers at the IC50 concentration.
(A) Western blot results for each cell line. (B) A graphic bar chart to show the changes in the intensity levels of the studied proteins in the IC50-treated and untreated cells. *** indicated the statistical significance of the results at a P <0.001 compared to control untreated cells.

