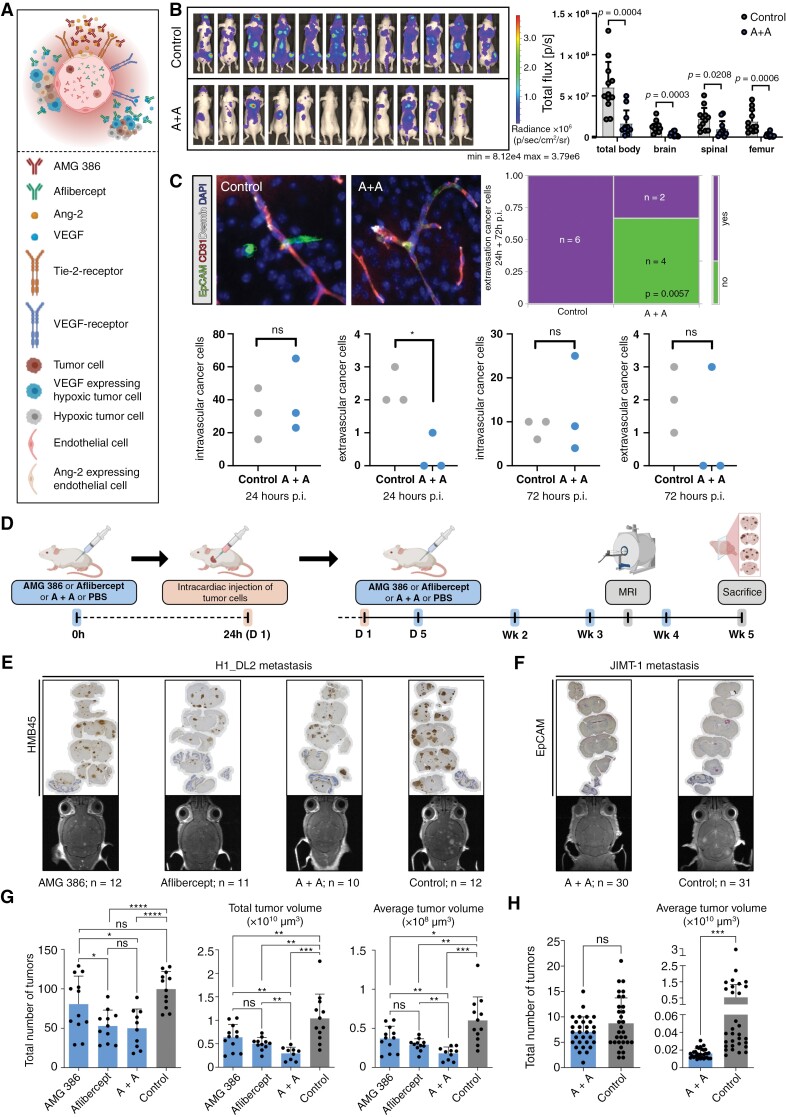
Figure 4.
(A) Scheme illustrating microenvironmental Ang-2 and VEGF blocking in brain metastases formation. (B) Bioluminescence imaging 2 weeks after intracardial H1_DL2 injection. Regions of interest “total body,” “brain,” “spinal” and “femur” were defined and measured accordingly. Results of PBS-treated animals (control) and AMG 386 and aflibercept (A + A) treated animals are depicted. Statistical analysis was performed by Student`s t-test. (C) Quantification of cancer cell extravasation in vibratome sections of PBS (control) and A + A treated animals are shown after 24 and 72 hours p.i.. The combination of the 24h and 72h p.i. experiments are shown in the upper right panel (purple: extravasation; green: no extravasation, P-value of likelihood ratio chi-square test is shown) (D) Experimental design of anti-Ang-2/anti-VEGF treatment in mice with intracardiac injection of H1_DL2 or JIMT-1 cells. (E-H) Assessment of melanoma (E, G) and breast carcinoma brain metastatic load (F, H) by MRI in week 4 after commencement of anti-angiogenic therapies in mice, including the total number of tumors and total/average tumor volumes in animals treated with AMG 386, aflibercept, or AMG 386 plus aflibercept compared to PBS treated controls. Immunostainings of coronal tissue sections for HMB45 (E) and EpCAM (F) visualize cerebral spread of H1_DL2 melanoma and JIMT-1 breast carcinoma metastases 5 weeks after initiation of anti-angiogenic therapies (trial endpoint). * P < .05, ** P < .01, *** P < .001, P < .0001 and ns P > .05 by 2-tailed, unpaired t-test.

