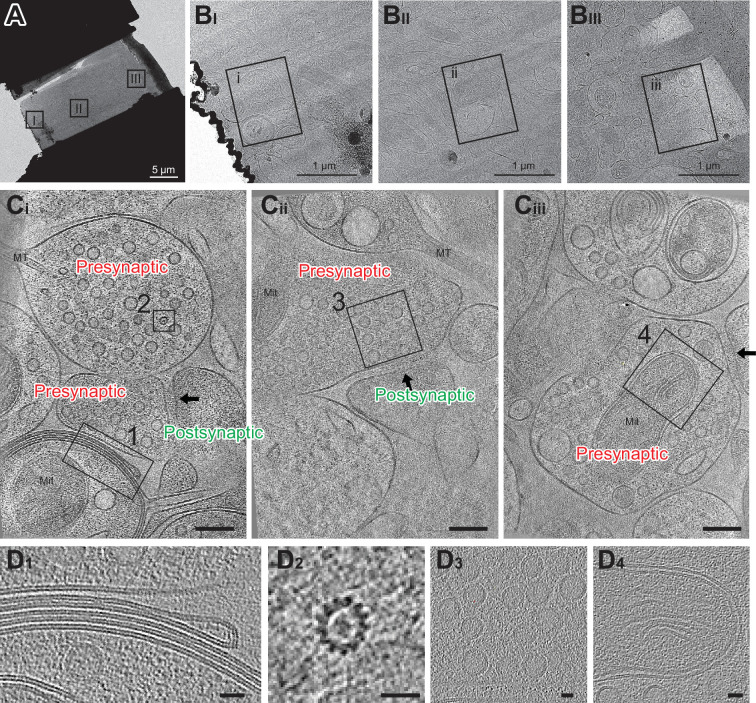
Figure 4. Cryo-electron tomography imaging of glutamatergic synapses within brain tissue.
(A) Medium montage map image of lamella. (B I-III) Enlarged images of lamella are indicated in A. (C i-iii) Slices from SIRT-filtered tomograms were collected at squares indicated in B. The synaptic cleft in each tomogram is indicated with a black arrow. Mit: mitochondria and MT: microtubule side views. One gold fiducial is visible in C iii. Scale bars are 100 nm. Each slice shown is about 10 nm thick. (D) Example image of myelin membranes (D1), top-down view of microtubule (D2), synaptic vesicles (D3), and part of a mitochondria (D4). Scale bars are 20 nm. Each slice shown is 10 nm thick.


