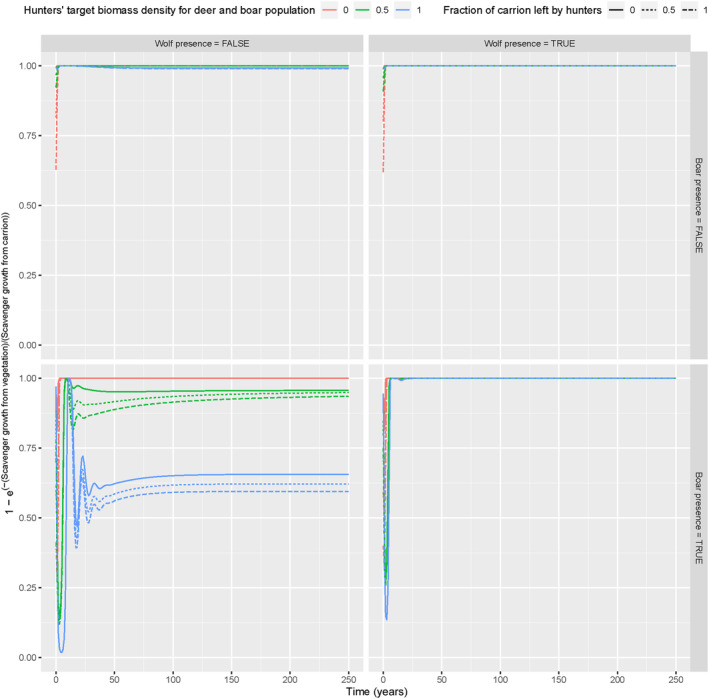
FIGURE 3.

Scavenger growth from vegetation versus scavenger growth from carrion ODE model simulations (y‐axis, transformed from [0, ∞] to [0, 1] range) over time (x‐axis), with boar (horizontal panels) and wolf present/absent (vertical panels), for different hunting target values (line colours) and fractions of carrion left by hunters (line types).
