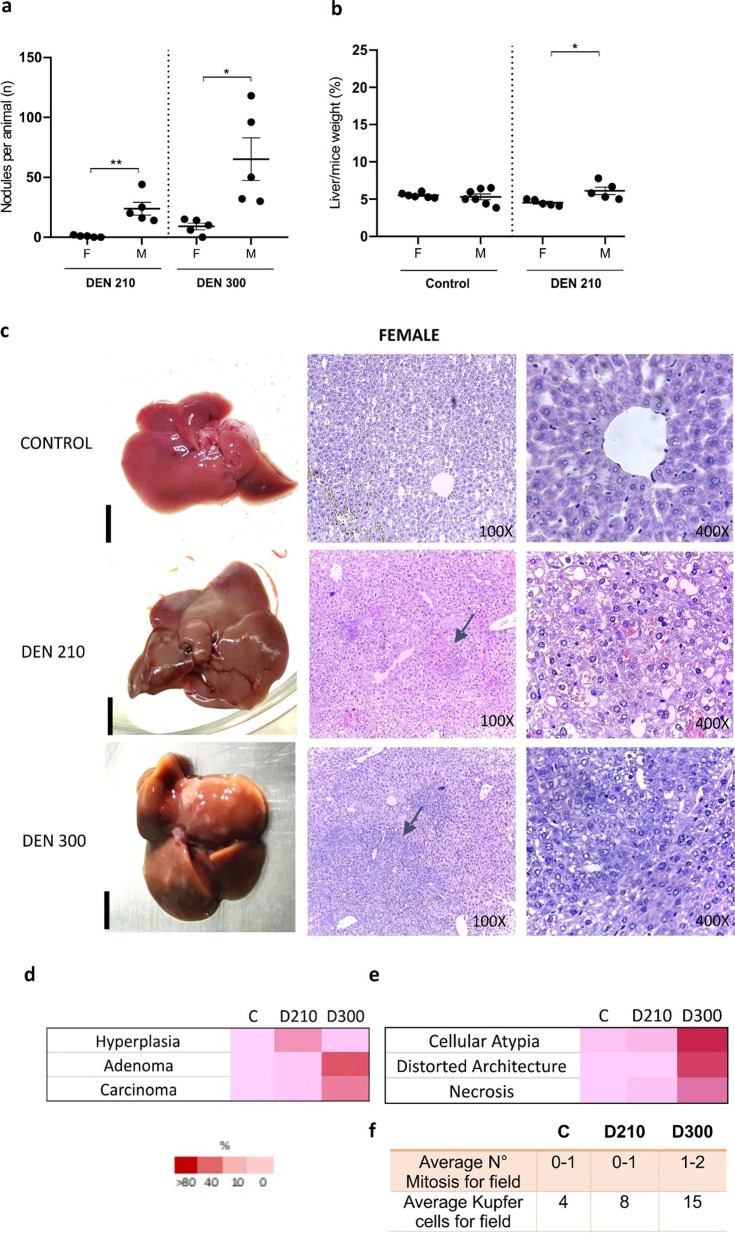
Fig. 1.
Development of liver tumors induced by diethylnitrosamine (DEN) in female C3H mice 210- and 300-days post-DEN. (a) Number of macroscopic nodules per animal at 210- and 300-days post-DEN. Nodules at the surface of each lobe were counted using a microscope (black bars: 5 mm). Data represent the mean ± SEM of nodules per liver (n) of 5–7 mice per group. (b) Percentage of liver weight concerning weight (%) of control mice and DEN-treated mice 210 and 300 days after inoculation. Data represent the mean ± SEM of weight (%) of 5–7 mice per group. Statistical comparison among experimental groups: *P<0.05; **P<0.02; ***P<0.01. ANOVA followed by the Tukey test was used. (c) Representative macroscopic and histopathological images of female control and DEN-treated mice 210 and 300 days after inoculation. Haematoxylin and eosin (H&E) staining, 100 and 400×. Day 210 post DEN: the image shows hepatic hyperplasia (arrows, 100×). The nuclei appear small and contain clumped chromatin. The cytoplasm displays vacuoles and primarily exhibits basophilic material (400×). Day 300 post DEN: the image shows hepatic adenoma, which exerts compressive effects on adjacent parenchyma. (arrows, 100×). Note the presence of variable nuclear sizes and occasional binucleated cells. The cytoplasm is vacuolated with basophilic material. (d) Heat map represents the percentages of hyperplasias, adenomas, and carcinomas diagnosed within each experimental group of females, including controls, and at days 210 and 300 post-DEN treatment. (e) Detailed information on the degree of cellular atypia, distortion of liver architecture, and necrosis in DEN-treated females. The heat map indicates a semiquantitative analysis of the respective liver histologic features, ranging from faint red (not present) to dark red (a feature present in all/almost all liver sections). (f) Average numerical values for mitosis and Kupffer cells per field. Ten fields per liver were analyzed. Due to the lack of significant histological changes observed in the control groups euthanized on day 210 and day 300, the data from the controls on day 210 is depicted in the figure for simplification purposes.

