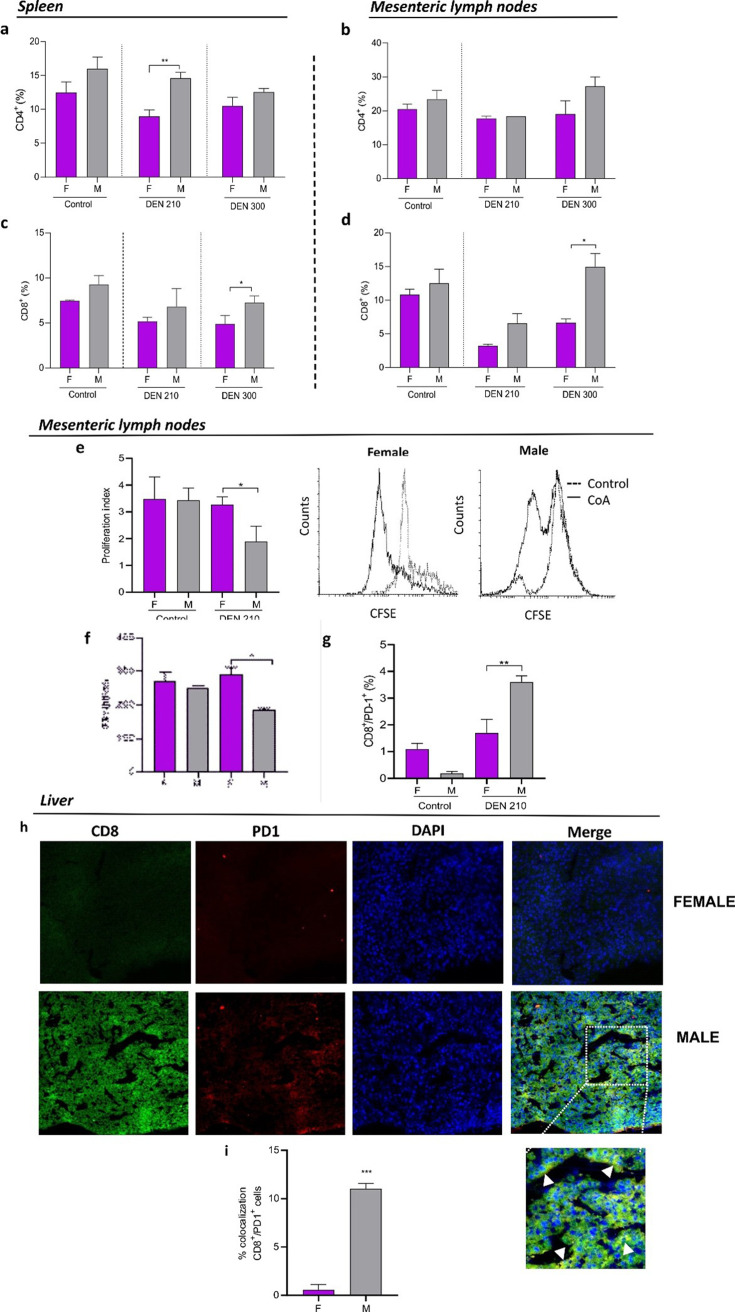
Fig. 4.
T lymphocytes in liver, spleen, and mesenteric lymph nodes of male and female diethylnitrosamine (DEN) − treated C3H mice. Percentage of CD4+ T lymphocytes in the spleen (a) and lymph node (b), and percentage of CD8+ T lymphocytes in the spleen (c) and lymph node (d) from female or male control mice, and DEN-treated C3H mice. (e) Proliferation index of CD8+ T lymphocytes and representative CFSE flow cytometric histograms of lymph nodes from female or male control and DEN-treated C3H mice (f) IFN-γ concentration in the supernatant of CD8 T lymphocyte cultures of lymph nodes from female or male control and DEN − treated C3H mice evaluated by ELISA assay. (g) Percentage of PD-1+ in CD8+ T lymphocytes of lymph nodes from female or male control mice and DEN-treated C3H mice. Results are expressed as mean ± SEM of percentage (%) of cells. n=5 mice per group were used. *P<0.05; **P<0.01. All statistical analyses of this figure were performed using ANOVA followed by the Tukey test. F=female; M=male. (h) Representative immunofluorescence showing colocalization between CD8 lymphocytes (green) and PD-1 (red). (i) Signal overlap was quantified using MBF-Image J. Pearson’s colocalization coefficients were calculated from three independent experiments and then converted to percentages (***P<0.001).

