FIGURE 4.

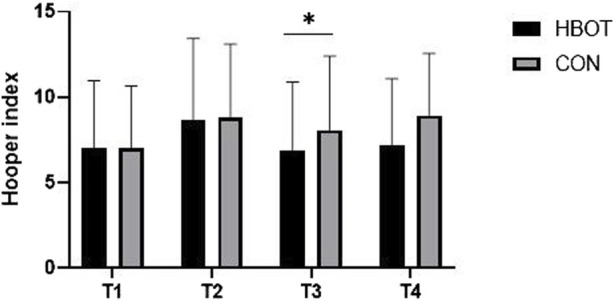
Hooper index (HI) values measured throughout four time points: pre-match (T1), post-match (T2), 1 hour after HBOT (T3) and 12 h after HBOT (T4). Note: comparisons are presented as HBOT vs. CON.

Hooper index (HI) values measured throughout four time points: pre-match (T1), post-match (T2), 1 hour after HBOT (T3) and 12 h after HBOT (T4). Note: comparisons are presented as HBOT vs. CON.